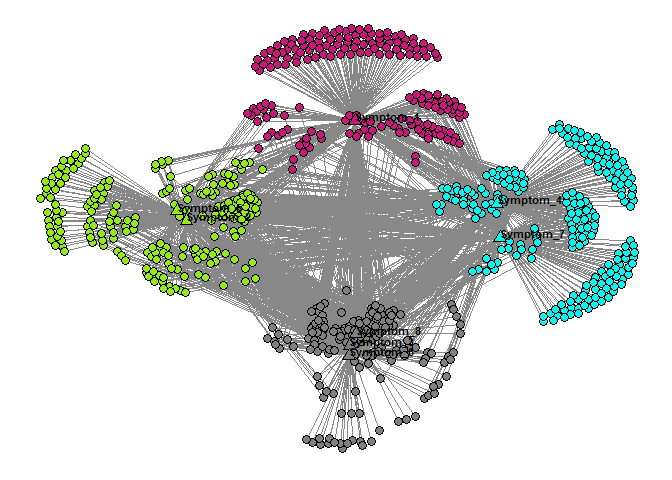
The ExplodeLayout algorithm takes as input (1) an edge list of a unipartite or bipartite network, (2) node layout coordinates (x, y) generated by a layout algorithm such as Kamada Kawai, (3) node cluster membership generated from a clustering algorithm such as modularity maximization, and (4) a radius to enable the node clusters to be “exploded” to reduce their overlap. The algorithm uses these inputs to generate new layout coordinates of the nodes which “explodes” the clusters apart, such that the edge lengths within the clusters are preserved, while the edge lengths between clusters are recalculated. The modified network layout with nodes and edges are displayed in two dimensions. This package is a basic version of an earlier version called epl that offered multiple ways to separate clusters in a network (see PMID: 28815099).
You can install the development version of ExplodeLayout like so:
install.packages("remotes")
remotes::install_github("DIVA-Lab-UTMB/ExplodeLayout")The following describes how to use ExplodeLayout for a simple network:
library(ExplodeLayout)
str(example_nodelist)
#> 'data.frame':    806 obs. of  5 variables:
#>  $ Label  : chr  "Patient_1" "Patient_2" "Patient_3" "Patient_4" ...
#>  $ Cluster: int  2 2 2 4 4 2 3 2 4 2 ...
#>  $ X      : num  3.379 2.242 -1.436 0.465 4.62 ...
#>  $ Y      : num  3.06 2.07 -3.47 2.26 2.8 ...
#>  $ Entity : num  1 1 1 1 1 1 1 1 1 1 ...
str(example_incidmat)
#> 'data.frame':    798 obs. of  8 variables:
#>  $ Symptom_1: int  1 1 0 1 1 1 0 1 0 0 ...
#>  $ Symptom_2: int  1 1 0 1 1 1 0 1 1 0 ...
#>  $ Symptom_3: int  1 1 0 1 0 0 0 0 1 0 ...
#>  $ Symptom_4: int  1 1 0 1 1 1 1 1 1 0 ...
#>  $ Symptom_5: int  1 1 1 1 0 1 0 1 1 1 ...
#>  $ Symptom_6: int  0 1 0 1 1 1 0 1 1 0 ...
#>  $ Symptom_7: int  1 1 0 0 1 1 1 1 1 0 ...
#>  $ Symptom_8: int  1 0 1 1 1 1 0 1 1 0 ...
exploded_nodelist=get_explode_nodelist(example_nodelist,radius=1.2)
str(exploded_nodelist)
#> 'data.frame':    806 obs. of  5 variables:
#>  $ Label    : chr  "Patient_1" "Patient_2" "Patient_3" "Patient_4" ...
#>  $ X        : num  -3.579 -5.075 -11.646 0.569 4.626 ...
#>  $ Y        : num  3.02 3.19 2.17 -6.8 -5.75 ...
#>  $ Color    : chr  "#94EA18" "#94EA18" "#94EA18" "#808080" ...
#>  $ baseShape: num  21 21 21 21 21 21 21 21 21 21 ...
p=plot_binet_ggplot2(exploded_nodelist,example_incidmat)
print(p)
Please read the documentation using
?get_explode_nodelist, ?plot_binet_ggplot2,
?example_nodelist, or ?example_incidmat for
more details.