
The cdom package implements various functions used to model and calculate metrics from absorption spectra of chromophotic dissolved organic matter (CDOM).
This package provides:
The package can be installed using the following command.
devtools::install_github("PMassicotte/cdom")Please note that this is a developing version of the package for testing only. Please fill an issue when you find bugs.
All functions from the package start with the cdom_
prefix.
library(cdom)
ls("package:cdom")
## [1] "cdom_fit_exponential" "cdom_slope_ratio"     "cdom_spectral_curve"
## [4] "spectra"The cdom_fit_exponential() function fits an exponential
curve to CDOM data using the simple model proposed by Jerlov (1968),
Lundgren (1976), Bricaud, Morel, and Prieur (1981).
a(\lambda) = a(\lambda0)e^{-S(\lambda - \lambda0)} + Klibrary(ggplot2)
library(cdom)
data("spectra")
fit <- cdom_fit_exponential(wl = spectra$wavelength,
absorbance = spectra$spc3,
wl0 = 350,
startwl = 190,
endwl = 900)
ggplot(spectra, aes(x = wavelength, y = spc3)) +
geom_point() +
geom_line(aes(y = fit$data$.fitted), col = "red") +
xlab("Wavelength (nm)") +
ylab(expression(paste("Absorption (", m ^ {-1}, ")")))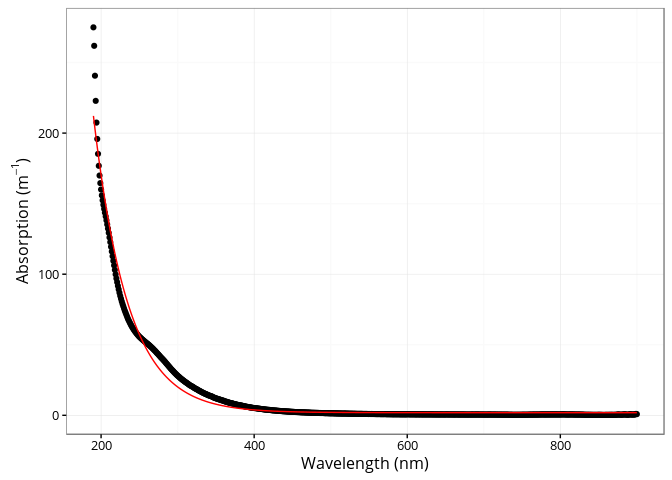
The cdom_slope_ratio() function calculates the slope
ratio (SR) which is defined as:
S275-295/S350-400. See Helms et al. (2008) for
detailed information.
library(cdom)
data("spectra")

cdom_slope_ratio(spectra$wavelength, spectra$spc1)
## [1] 1.325082
The cdom_spectral_curve() function generates the
spectral curve using the slope of the linear regression between the
natural log absorption spectrum and wavelengths over a sliding window of
21 nm interval (default) at 1 nm resolution. See Loiselle et al. (2009)
for detailed information.
library(cdom)
data("spectra")

res <-  cdom_spectral_curve(wl = spectra$wavelength,
                       absorbance = spectra$spc10,
                       interval = 21,
                       r2threshold = 0.98) # Maybe to restrictive...

ggplot(res, aes(x = wl, y = s)) +
  geom_point() +
  geom_line() +
  xlab("Wavelength (nm)") +
  ylab(expression(paste("Spectral slope (", nm ^ {-1}, ")")))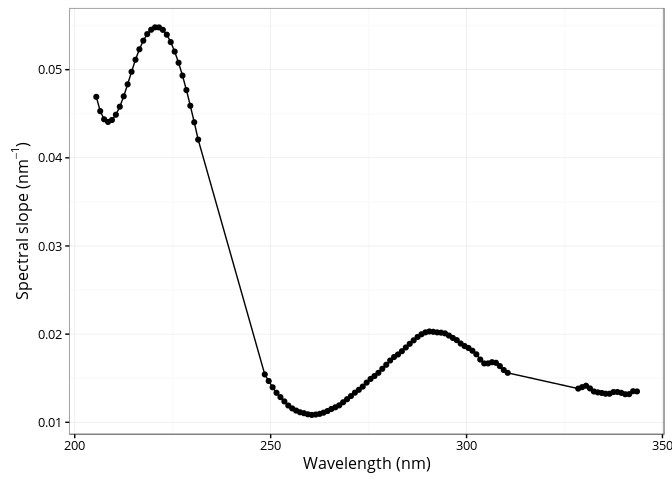
A total 25 absorption spectra are provided in the package.
library(ggplot2)
library(tidyr)
data("spectra")

spectra <- gather(spectra, sample, absorption, -wavelength)

ggplot(spectra, aes(x = wavelength, y = absorption, group = sample)) +
  geom_line(size = 0.1) +
  xlab("Wavelength (nm)") +
  ylab(expression(paste("Absorption (", m ^ {-1}, ")")))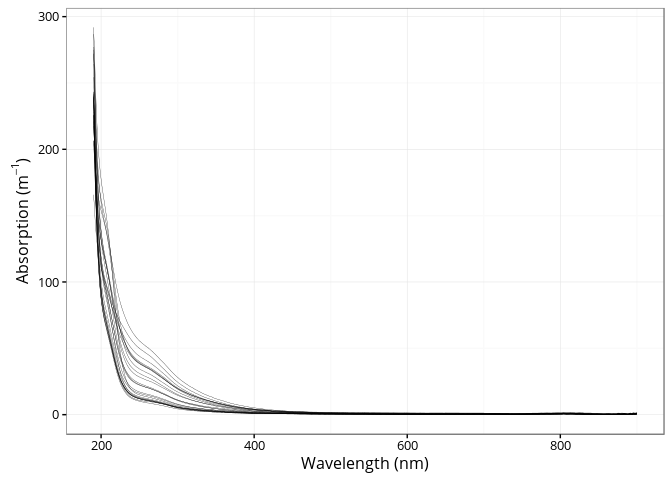
citation("cdom")
##
## To cite cdom in publications use:
##
##   Massicotte, P., and Markager, S. (2016). Using a Gaussian
##   decomposition approach to model absorption spectra of
##   chromophoric dissolved organic matter. Mar. Chem. 180, 24-32.
##   doi:10.1016/j.marchem.2016.01.008.
##
## A BibTeX entry for LaTeX users is
##
##   @Article{,
##     title = {Using a Gaussian decomposition approach to model absorption spectra of chromophoric dissolved organic matter},
##     author = {Philippe Massicotte and Stiig Markager},
##     journal = {Marine Chemistry},
##     year = {2016},
##     volume = {180},
##     pages = {24--32},
##     url = {http://linkinghub.elsevier.com/retrieve/pii/S0304420316300081},
## }Bricaud, Annick, André Morel, and Louis Prieur. 1981. “Absorption by dissolved organic matter of the sea (yellow substance) in the UV and visible domains.” Limnology and Oceanography 26 (1): 43–53. doi:10.4319/lo.1981.26.1.0043.
Helms, John R., Aron Stubbins, Jason D. Ritchie, Elizabeth C. Minor, David J. Kieber, and Kenneth Mopper. 2008. “Absorption spectral slopes and slope ratios as indicators of molecular weight, source, and photobleaching of chromophoric dissolved organic matter.” Limnology and Oceanography 53 (3): 955–69. doi:10.4319/lo.2008.53.3.0955.
Jerlov, N.G. 1968. Optical oceanography. New York: Elsevier Publishing Company.
Loiselle, Steven A., Luca Bracchini, Arduino M. Dattilo, Maso Ricci, Antonio Tognazzi, Andres Cézar, and Claudio Rossi. 2009. “The optical characterization of chromophoric dissolved organic matter using wavelength distribution of absorption spectral slopes.” Limnology and Oceanography 54 (2): 590–97. doi:10.4319/lo.2009.54.2.0590.
Lundgren, Bo. 1976. “Spectral transmittance measurements in the Baltic.” Copenhagen: Institute Physical Oceanography University of Copenhagen.