
![]()
![]()
Package ‘gginnards’ (Explore the innards of ‘ggplot2’) is a set of extensions to R package ‘ggplot2’. Two geometries and two statistics are specially useful when learning how to write ‘ggplot2’ extensions and when debugging newly defined statistics and geometries.
Objects of class "gg", or unrendered ggplot objects, are a list-like structure containing data and “instructions” to construct a plot and its layers. By editing this structure it is possible to modify the plot that will be rendered. Functions are provided for the manipulation of layers within ggobjects. These can be useful in the case extensions to ‘ggplot2’ that define functions that construct and return whole gg objects. In such cases in can be useful to programatically edit these gg objects to insert plot layers or change their order.
As the variables returned in data by many statistics depend on input, some of these tools can be also useful in everyday plotting with ‘gplot2’ as a way of diagnosing problems or getting information that is missing from their documentation or only available at runtime.
Because of its nature, this package does not always play safe and nice even if it tries to. No exported or internal function or object should be imported or used in other packages, simply because they may change at any time (as in version 0.2.0). Although I intend to maintain the package, I will not attempt to actively keep it compatible with anything but the current version of ‘ggplot2’, although it will frequently also work with some earlier versions. Please, see the blog post Playing on the same team as your dependecy by Thomas Lin Pedersen.
The debug statistics and geoms are defined in ‘gginnards’ using the same approach as other ‘ggplot2’ extensions, without any significant assumptions about the internals of ‘ggplot2’. Thus, they are unlikely to be affected by minor updates to ‘ggplot2’. The layer manipulation functions rely on the internal structure of "gg" objects, but mostly on aspects unlikely to change frequently.
Package ‘gginnards’ does not provide a deep view into the structure of "gg" objects or the steps involved in building these objects and rendering them into graphical objects. Package ‘ggtrace’ by June Choe provides tools for a much deeper and detailed exploration and edition of ggplots, but it is much more dependent on the undocumented internals of ‘ggplot2’ than ‘gginnards’. (Note: there exists another package named ggtrace for a different purpose. None of them are yet available through CRAN.)
This package was born when several functions were extracted from package ‘ggpmisc’ and packaged on their own.
Geometries geom_debug_panel() and geom_debug_droup() by default print the data object received as input by the draw functi to the console adding a plot layer that produces no graphic output. As they take as arguments summary functions, they allows flexibility in how data objects are displayed. geom_debug_panel() and geom_debug_droup() are useful at any time when one needs to check what variables are returned by statistics. Many statistics are well documented and always return the same variables. For other statistics even if well documented the returned variables in data vary depending on grouping and/or the arguments passed to them, in which case this geometry can also be useful when debugging scripts.
Statistics stat_debug_panel() and stat_debug_droup() echo their data input to the R console aim at easing debugging during development of new geoms and statistics. They will also help those learning how ggplot grouping, panels and layers work. As the debug geometries, they take as arguments summary functions allowing flexibility in how data objects are displayed.
For debugging, the value returned by these stats is usually not interesting, and by default, it is a copy of the data object received as input. This can be changed by passing a function as argument to fun.data. This could be useful to produce data summaries to be plotted as a layer. This may even work as a tool useful to build ad-hoc statistics with rudimentary built-in debugging.
A set of functions easy the manipulation of layers in ggplot objects, allowing deletion of any existing layer, insertion of new layers at any position, and reordering of the existing layers.
A function to drop unused variables from the data object embedded in gg and ggplot objects serves as an additional example of a manipulation that may be useful when dealing with very large datasets. Companion functions are defined to explore the embedded data object.
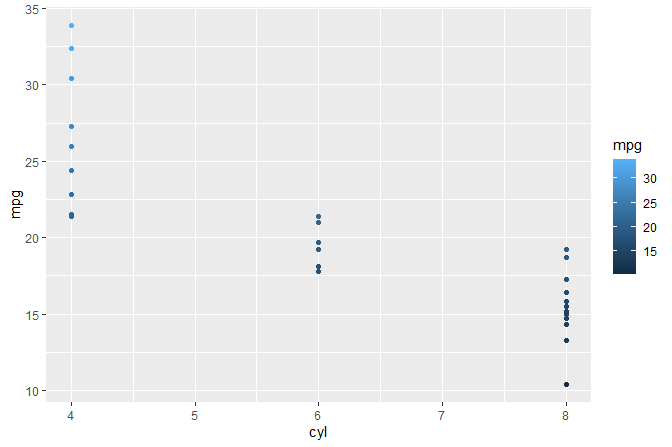
We print to the R console data as seen as input by geometries and statistics.
#> [1] "PANEL 1; group(s) -1; 'draw_panel()' input 'data' (head):"
#>    colour x    y PANEL group
#> 1 #30648F 6 21.0     1    -1
#> 2 #30648F 6 21.0     1    -1
#> 3 #356E9D 4 22.8     1    -1
#> 4 #316692 6 21.4     1    -1
#> 5 #29577E 8 18.7     1    -1
#> 6 #275379 6 18.1     1    -1
#> [1] "PANEL 1; group(s) -1; 'draw_panel()' input 'params' (summary):"
#>         Length Class     Mode
#> x       11     ViewScale environment
#> x.sec   11     ViewScale environment
#> x.range  2     -none-    numeric
#> y       11     ViewScale environment
#> y.sec   11     ViewScale environment
#> y.range  2     -none-    numeric
#> guides   4     Guides    environment
We print to the R console colnames(data).
ggplot(mtcars, aes(cyl, mpg, color = mpg)) +
  geom_point() +
  geom_debug_panel(dbgfun.data = colnames, dbgfun.params = NULL)
#> [1] "PANEL 1; group(s) -1; 'draw_panel()' input 'data' (anonymous function):"
#> [1] "colour" "x"      "y"      "PANEL"  "group"
We print to the R console data as returned by stat_summary() and seen as input by geometries.
ggplot(mtcars, aes(cyl, mpg, colour = factor(cyl))) +
  stat_summary(fun.data = "mean_cl_boot") +
  stat_summary(fun.data = "mean_cl_boot", geom = "debug_panel")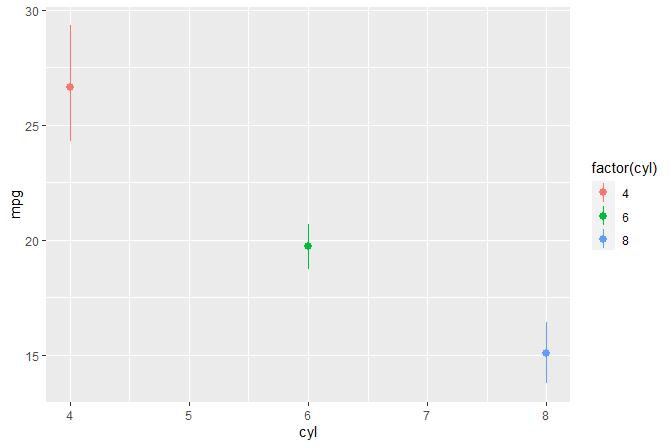
#> [1] "PANEL 1; group(s) 1, 2, 3; 'draw_function()' input 'data' (head):"
#>    colour x group        y     ymin     ymax PANEL flipped_aes orientation
#> 1 #F8766D 4     1 26.66364 24.26341 29.21841     1       FALSE          NA
#> 2 #00BA38 6     2 19.74286 18.78571 20.65714     1       FALSE          NA
#> 3 #619CFF 8     3 15.10000 13.74268 16.37875     1       FALSE          NA
We print to the R console data as seen as input by statistics that use a panel function.
#> [1] "PANEL 1; group(s) 1, 2, 3; 'compute_panel()' input 'data' (head):"
#> x y colour PANEL group
#> 1 6 21.0 6 1 2
#> 2 6 21.0 6 1 2
#> 3 4 22.8 4 1 1
#> 4 6 21.4 6 1 2
#> 5 8 18.7 8 1 3
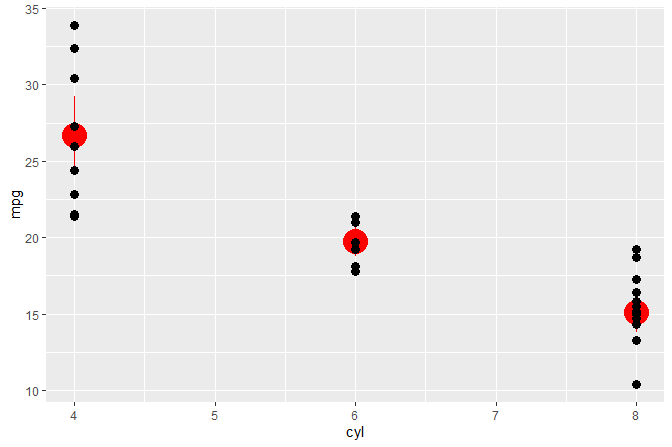
#> 6 6 18.1 6 1 2We build object p of class gg (a ggplot). We query the number of layers and the position of layers by the class of the ggproto object.
p <-
  ggplot(mtcars, aes(cyl, mpg)) +
  geom_point(size = 3) +
  stat_summary(fun.data = "mean_cl_boot", color = "red", size = 2)

  num_layers(p)
#> [1] 2
  which_layers(p, "GeomPoint")
#> [1] 1
  which_layers(p, "StatSummary")
#> [1] 2

  p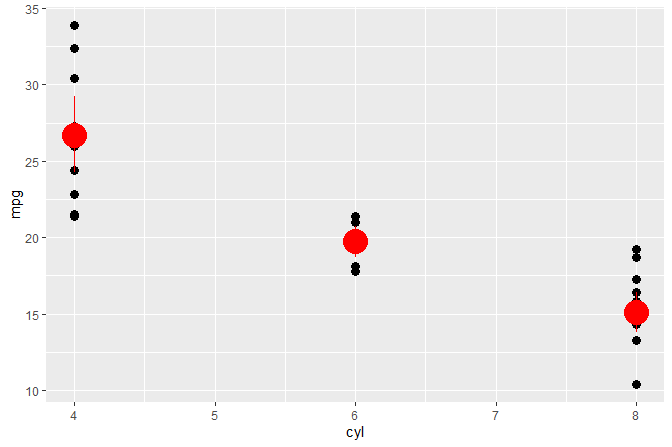
Installation of the most recent stable version from CRAN (sources, Mac and Win binaries):
Installation of the current unstable version from R-Universe CRAN-like repository (binaries for Mac, Win, Webassembly, and Linux, as well as sources available):
install.packages('gginnards',
                 repos = c('https://aphalo.r-universe.dev',
                           'https://cloud.r-project.org'))
Installation of the current unstable version from GitHub (from sources):
HTML documentation is available at (https://docs.r4photobiology.info/gginnards/), including two vignettes.
News about updates are regularly posted at (https://www.r4photobiology.info/).
Please report bugs and request new features at (https://github.com/aphalo/gginnards/issues). Pull requests are welcome at (https://github.com/aphalo/gginnards).
If you use this package to produce scientific or commercial publications, please cite according to:
citation("gginnards")
#> To cite package 'gginnards' in publications use:
#>
#>   Aphalo P (2024). _gginnards: Explore the Innards of 'ggplot2'
#>   Objects_. R package version 0.2.0,
#>   https://github.com/aphalo/gginnards,
#>   <https://www.r4photobiology.info>.
#>
#> A BibTeX entry for LaTeX users is
#>
#>   @Manual{,
#>     title = {gginnards: Explore the Innards of 'ggplot2' Objects},
#>     author = {Pedro J. Aphalo},
#>     year = {2024},
#>     note = {R package version 0.2.0, https://github.com/aphalo/gginnards},
#>     url = {https://www.r4photobiology.info},
#> }© 2016-2024 Pedro J. Aphalo (pedro.aphalo@helsinki.fi). Released under the GPL, version 2 or greater. This software carries no warranty of any kind.