
Copyright (C) 2022, Hongfei Liu 2022/08/16
![]()
![]()
The goal of handyFunctions is to get rid of the barrier to deal with non-standard data.frame format for R newbies, especially the user in bioinformatics data analysis. Besides, there are also some required plot functions for downstream analysis of dataset generated from vcftools and plink.
You can install the development version of handyFunctions like so:
## Clone it from github and install it locally
git clone https://github.com/LuffyLouis/handyFunctions.git
## OR
## Install it in R
remotes::install_github("LuffyLouis/handyFunctions")handyFunctionspackage contain three main sections,
including ReformatDataframe, InteractDataframe, and Post-VCF. There are
some basic examples which show you how to solve common problems in data
analysis:
This section is designed to reformat data.frame with odd colnames, rownames, or even inappropriate dtypes for each columns.
Based on the following example unifyDataframe function,
you can change the formats of raw data.frame to what you want.
Especially for the dtypes in data.frame, you can set
custom=FALSE for automatically changing into appropriate
dtypes.
library('handyFunctions')
data("people")
head(people)
#>          ..name  ..sex ..age ..death..age
#> 1       Ming Li   male    12           34
#> 2    Zixuan Liu female    23       thirty
#> 3    Yizhen Zhu   male    NA           54
#> 4 Lingling Wang female    21           77
#> 5      Bang Wei   male    11         <NA>
#> 6   Xiaoyu Chen female    74           89
modifiedPeople <- unifyDataframe(people,rawColSep = '[.][.]')
head(modifiedPeople)
#>            name    sex  age death_age
#> 1       Ming Li   male   12        34
#> 2    Zixuan Liu female   23    thirty
#> 3    Yizhen Zhu   male <NA>        54
#> 4 Lingling Wang female   21        77
#> 5      Bang Wei   male   11      <NA>
#> 6 Xiaoyu Chen female 74 89Note: due to the separation supporting regEx, please
use the "[.][.]" for reformatting people
data.frame.
The InteractDataframe section is designed for
interaction between two data.frame or one data.frame and another
vector.
Sometimes, we often find it fuzzy and tedious while we’d like to
merge two data.frame with different colnames. Therefore,
mergeCustom function may be the better solution to get it
rid of.
library('handyFunctions')
data("people");data("grade")
head(people)
#>          ..name  ..sex ..age ..death..age
#> 1       Ming Li   male    12           34
#> 2    Zixuan Liu female    23       thirty
#> 3    Yizhen Zhu   male    NA           54
#> 4 Lingling Wang female    21           77
#> 5      Bang Wei   male    11         <NA>
#> 6   Xiaoyu Chen female    74           89
head(grade)
#>            name chinese math english physics biology chemistry
#> 1       Ming Li     120  130     145      80      90        99
#> 2    Zixuan Liu     109  120     110      85      99        88
#> 3    Yizhen Zhu      98  113     100      74     100        76
#> 4 Lingling Wang     138  145     126      55      89       100
#> 5      Bang Wei     119  105     139     100      78        99
#> 6   Xiaoyu Chen     119  105     120      69      80        77
merged <- mergeCustom(people,grade,xcol = '..name',ycol = 'name')
head(merged)
#>          ..name  ..sex ..age ..death..age chinese math english physics biology
#> 1      Bang Wei   male    11         <NA>     119  105     139     100      78
#> 2 Lingling Wang female    21           77     138  145     126      55      89
#> 3       Ming Li   male    12           34     120  130     145      80      90
#> 4   Xiaoyu Chen female    74           89     119  105     120      69      80
#> 5    Yizhen Zhu   male    NA           54      98  113     100      74     100
#> 6    Zixuan Liu female    23       thirty     109  120     110      85      99
#>   chemistry
#> 1        99
#> 2       100
#> 3        99
#> 4        77
#> 5        76
#> 6 88library('handyFunctions')
library('ggplot2')
data("SNV_1MB_density_data")
head(SNV_1MB_density_data)
#> CHROM BIN_START SNP_COUNT VARIANTS.KB
#> 1 1 0 253 0.253
#> 2 1 1000000 31 0.031
#> 3 1 2000000 208 0.208
#> 4 1 3000000 77 0.077
#> 5 1 4000000 204 0.204
#> 6 1 5000000 75 0.075
ShowSNPDensityPlot(SNV_1MB_density_data,binSize=1e6,chromSet = c(38:1),withchr=T)+
theme(axis.text.y = element_text(size=12))
#> ## Filtering the density data with specific chrom set...
#> ## Judging if it should be added the chr and factoring...
#> ## Reformatting the raw density data...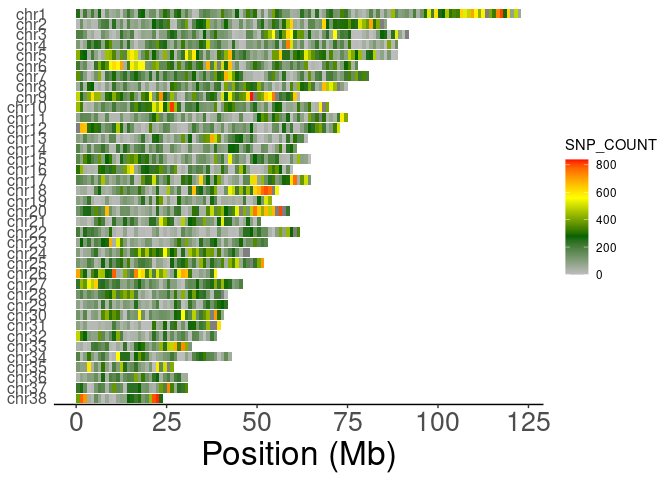
This project is published under MIT license, see file
LICENSE.