![]()
![]()
![]()
Visualization and Tools for Ichimoku Kinko Hyo Strategies
An implementation of ‘Ichimoku Kinko Hyo’, also commonly known as ‘cloud charts’. Static and interactive visualizations with tools for creating, backtesting and development of quantitative ‘ichimoku’ strategies. As described in Sasaki (1996, ISBN:4925152009), the technique is a refinement on candlestick charting, originating from Japan and now in widespread use in technical analysis worldwide. Translating as ‘one-glance equilibrium chart’, it allows the price action and market structure of financial securities to be determined ‘at-a-glance’. Incorporates an interface with the OANDA fxTrade API https://developer.oanda.com/ for retrieving historical and live streaming price data for major currencies, metals, commodities, government bonds and stock indices.
Install the latest release of ichimoku from CRAN:
Or the development version from R-universe:
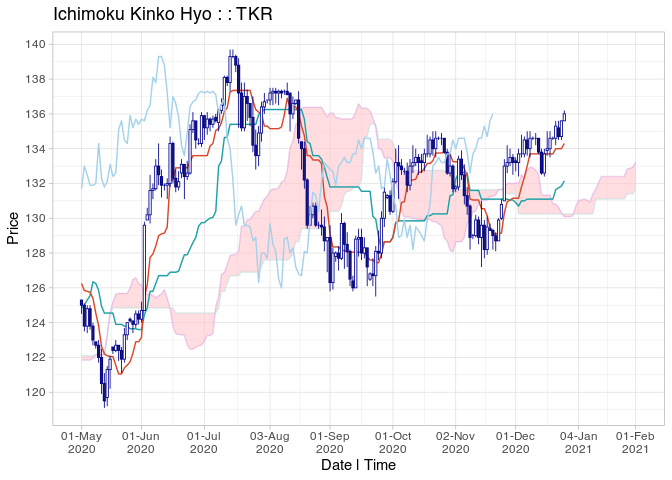
Simply ichimoku() and plot():
autostrat() to automatically evaluate and rank top-performing strategies:
autostrat(cloud, n = 3)
#>                        [,1]               [,2]              [,3]
#> Strategy               "senkouB > tenkan" "cloudB > tenkan" "senkouB > kijun"
#> ---------------------  "----------"       "----------"      "----------"
#> Strategy cuml return % 17.49              16.08             14.1
#> Per period mean ret %  0.0906             0.0838            0.0741
#> Periods in market      63                 51                64
#> Total trades           3                  3                 3
#> Average trade length   21                 17                21.33
#> Trade success %        100                100               100
#> Worst trade ret %      3.64               3.16              3.49
#> ---------------------  "----------"       "----------"      "----------"
#> Benchmark cuml ret %   5.53               5.53              5.53
#> Per period mean ret %  0.0302             0.0302            0.0302
#> Periods in market      178                178               178
#> ---------------------  "----------"       "----------"      "----------"
#> Direction              "long"             "long"            "long"
#> Start                  2020-04-20         2020-04-20        2020-04-20
#> End                    2020-12-23         2020-12-23        2020-12-23
#> Ticker "TKR" "TKR" "TKR"ichimoku() - to create an ichimoku object from price data.
plot() / iplot() - to plot (interactive) cloud charts from ichimoku objects.
archive() - for reading/writing objects to/from archive files with data verification.
oanda() - to retrieve price data from the OANDA fxTrade API.
strat() - to augment an ichimoku object with a strategy, including combined and asymmetric strategies.
autostrat() - to automatically evaluate and rank top-performing strategies.
mlgrid() - to generate a numeric representation of the ichimoku cloud chart.
relative() - to produce a statistical summary of the latest ichimoku numeric representation relative to historical values.
oanda_chart() - to plot real-time ichimoku cloud charts using OANDA data.
oanda_studio() - a complete live analysis environment using OANDA data implemented in R Shiny.
oanda_stream() / oanda_quote() - to obtain the latest live data stream / quote from the OANDA fxTrade API.
oanda_view() - for a market overview showing the relative performance of constituents.
oanda_orders() / oanda_positions() - to retrieve the aggregate OANDA fxTrade order / position book.
Long-form documentation links:
{ 1 } Cloud Charts - The Reference Manual
{ 2 } Beyond Visualization - Quantitative Strategies
{ 3 } Auxiliary Functions
{ 4 } The OANDA fxTrade API
Sasaki, H. 佐々木 英信 (1996), 一目均衡表の研究 [ichimoku kinkouhyou no kenkyuu]. Tokyo, Japan: Toushi Radar.
‘OANDA’ and ‘fxTrade’ are trademarks owned by OANDA Corporation, an entity unaffiliated with the ichimoku package.
–
◈ ichimoku R package: https://shikokuchuo.net/ichimoku/.
Listed CRAN Finance Task View: https://cran.r-project.org/view=Finance.
–
Please note that this project is released with a Contributor Code of Conduct. By participating in this project you agree to abide by its terms.