2014-10-01
This package is for automatic correlation and linear regeression test
of a data.frame like cor() in R. Function
cor() get r values from a numeric vector,
matrix or data.frame, but it does not work in a data.frame consist of
numeric, factor or character variables.
If you wanted to get p values as well as r
values, you should use cor.test instead of
cor. But cor.test can deal with only one pair
of numeric vectors of the same length, neither a matrix nor a
data.frame. Furthermore, if you wanted to get the slope and
intercept of simple linear regression line of xyplot, you
had to perform lm test for every pairs of numeric variables
of the data.frame.
The main function of this package is mycor(). It returns
an object of S3 class “mycor” consist of r values and
p values as well as slope and
intercept from lm() test. Plot “mycor” object is very
simple and convenient. Plot.mycor function has four types of plots.
require(mycor)
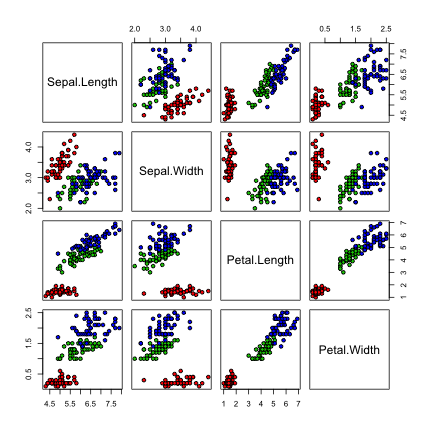
out=mycor(iris)
out
$ r value by Pearson's product-moment correlation

             Sepal.Length Sepal.Width Petal.Length Petal.Width
Sepal.Length        1.000      -0.118        0.872       0.818
Sepal.Width        -0.118       1.000       -0.428      -0.366
Petal.Length        0.872      -0.428        1.000       0.963
Petal.Width         0.818      -0.366        0.963       1.000

$ p value ( two.sided )

             Sepal.Length Sepal.Width Petal.Length Petal.Width
Sepal.Length        0.000       0.152            0           0
Sepal.Width         0.152       0.000            0           0
Petal.Length        0.000       0.000            0           0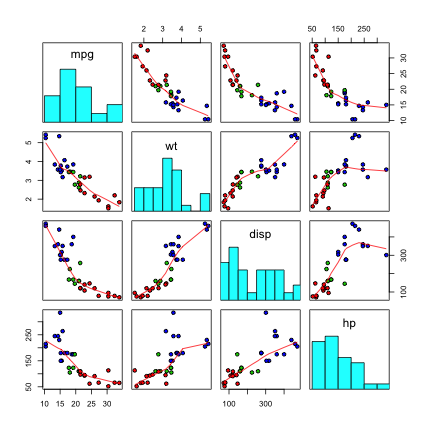
Petal.Width 0.000 0.000 0 0out1=mycor(~mpg+wt+disp+hp,data=mtcars)
plot(out,groups=Species)plot(out,type=4,groups=Spec)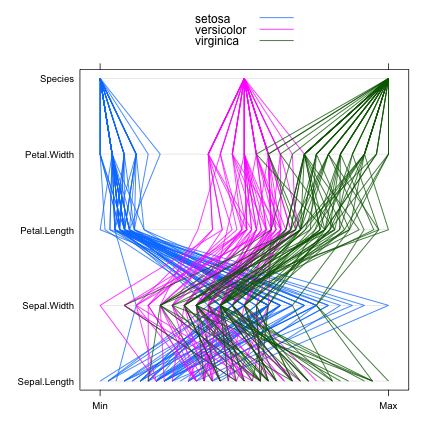
plot(out1,type=2,groups=cyl)