The goal of paramlink2 is to perform parametric linkage analysis in medical pedigrees. Both singlepoint and multipoint LOD scores are supported (the latter requires MERLIN). The package includes tools for visualising LOD scores and summarising peaks for use in downstream analysis.
paramlink2 is part of the ped suite collection of packages for pedigree analysis in R, featured in the book Pedigree Analysis in R (Vigeland, 2021). Chapter 9 of this book gives an introduction to linkage analysis, and includes a detailed worked example using paramlink2.
As hinted to by the package name, paramlink2 is a reinstalment of paramlink, which is no longer actively developed. The two version are not compatible, and all new users are recommended to use paramlink2.
To get the current official version of paramlink2, install from CRAN as follows:
install.packages("paramlink2")Alternatively, you can obtain the latest development version from GitHub:
# install.packages("devtools") # install devtools if needed
devtools::install_github("magnusdv/paramlink2")library(paramlink2)
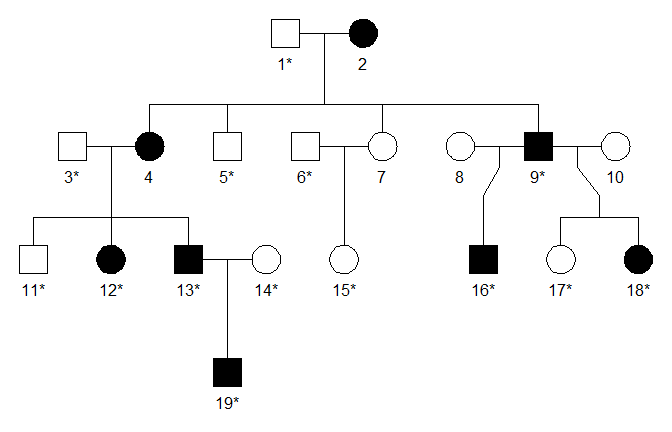
#> Loading required package: pedtoolsThe family below is affected with an autosomal dominant disorder. The
built-in dataset dominant1 contains genotypes for 14 of the
members, at 248 SNP markers on chromosome 1. We will perform parametric
linkage analysis on the dataset, hoping to identify a genomic region
linked to the disease locus.
The dataset contains three elements: ped,
aff and map. For simplicity we store these in
separate variables:
ped = dominant1$ped
aff = dominant1$aff
map = dominant1$map
The pedigree plot above was produced with the command
plot(ped, aff = aff, starred = typedMembers)In order to compute LOD scores, we need to provide a disease model.
This is conveniently done with the function diseaseModel().
For this example we use a fully penetrant autosomal dominant model:
modAD = diseaseModel("AD")

modAD
#> Autosomal inheritance
#> Penetrance: (f0, f1, f2) = (0, 1, 1)
#> Disease allele frequency: 1e-05
The diseaseModel() function contains a number optional
arguments which can be used to create more realistic models, including
phenocopies, reduced penetrance and liability classes. Consult the
documentation ?diseaseModel for details about these!
Singlepoint LOD scores for the family are now computed as follows:
lods = lod(ped, aff = aff, model = modAD)The summary() function prints the highest score:
summary(lods)
#> Max LOD score: 2.533179
#> Achieved at marker(s): m47
Furthermore, plot() produces a nice graph of the LOD
scores:
plot(lods)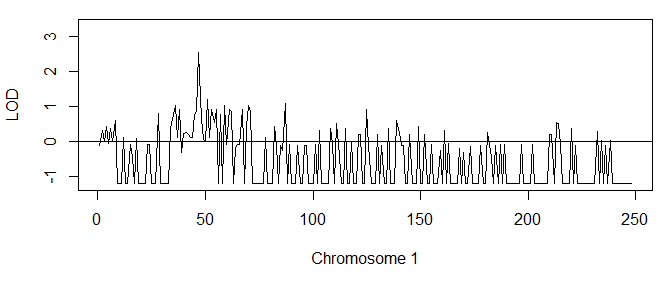
As typical for singlepoint scores, the graph is quite noisy and not
easy to interpret, although we see indications of a peak. A cleaner
picture may be obtained by multipoint analysis, which is
available if you have MERLIN installed on your computer. A special
wrapper, merlinLod() takes care of all the input and output
files to MERLIN, so that we never have to leave R. Moreover, the syntax
is similar to that of lod() except that we may add a
linkage map of the markers.
lodsM = merlinLod(ped, aff = aff, model = modAD, map = map)The following command plots the MERLIN scores together with the singlepoint scores:
plot(lods, col = 8)
points(lodsM, col = 2)
legend("topright", c("Multi", "Single"), col = c(2, 8), lwd = 2)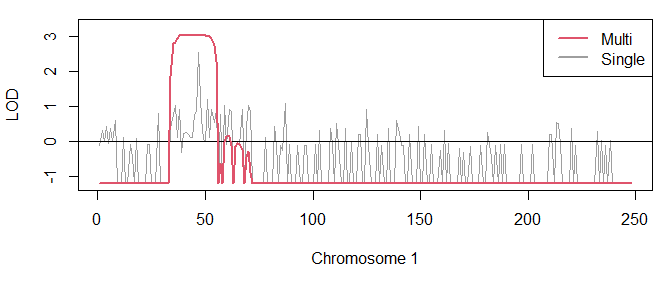
This graph shows a convincing peak of LOD = 3, which is close to the traditional significance threshold LOD = 3.3 for AD disorders. We print some details about the peak and its location:
peakSummary(lodsM, threshold = 2)
#>   CHROM FROM  TO  N FROM_MB TO_MB LEN TELO MAXLOD
#> 1     1  m34 m56 23      34    56  22        3.01
In other words, the disease locus is most likely somewhere on chromosome 1 between 34 Mb and 56 Mb.