![]()


![]()
![]()
powerly is an R package that implements the
method by Constantin et al.
(2021) for conducting sample size analysis for cross-sectional
network models. The method implemented is implemented in the main
function powerly()`. The implementation takes the form of a
three-step recursive algorithm designed to find an optimal sample size
value given a model specification and an outcome measure of interest. It
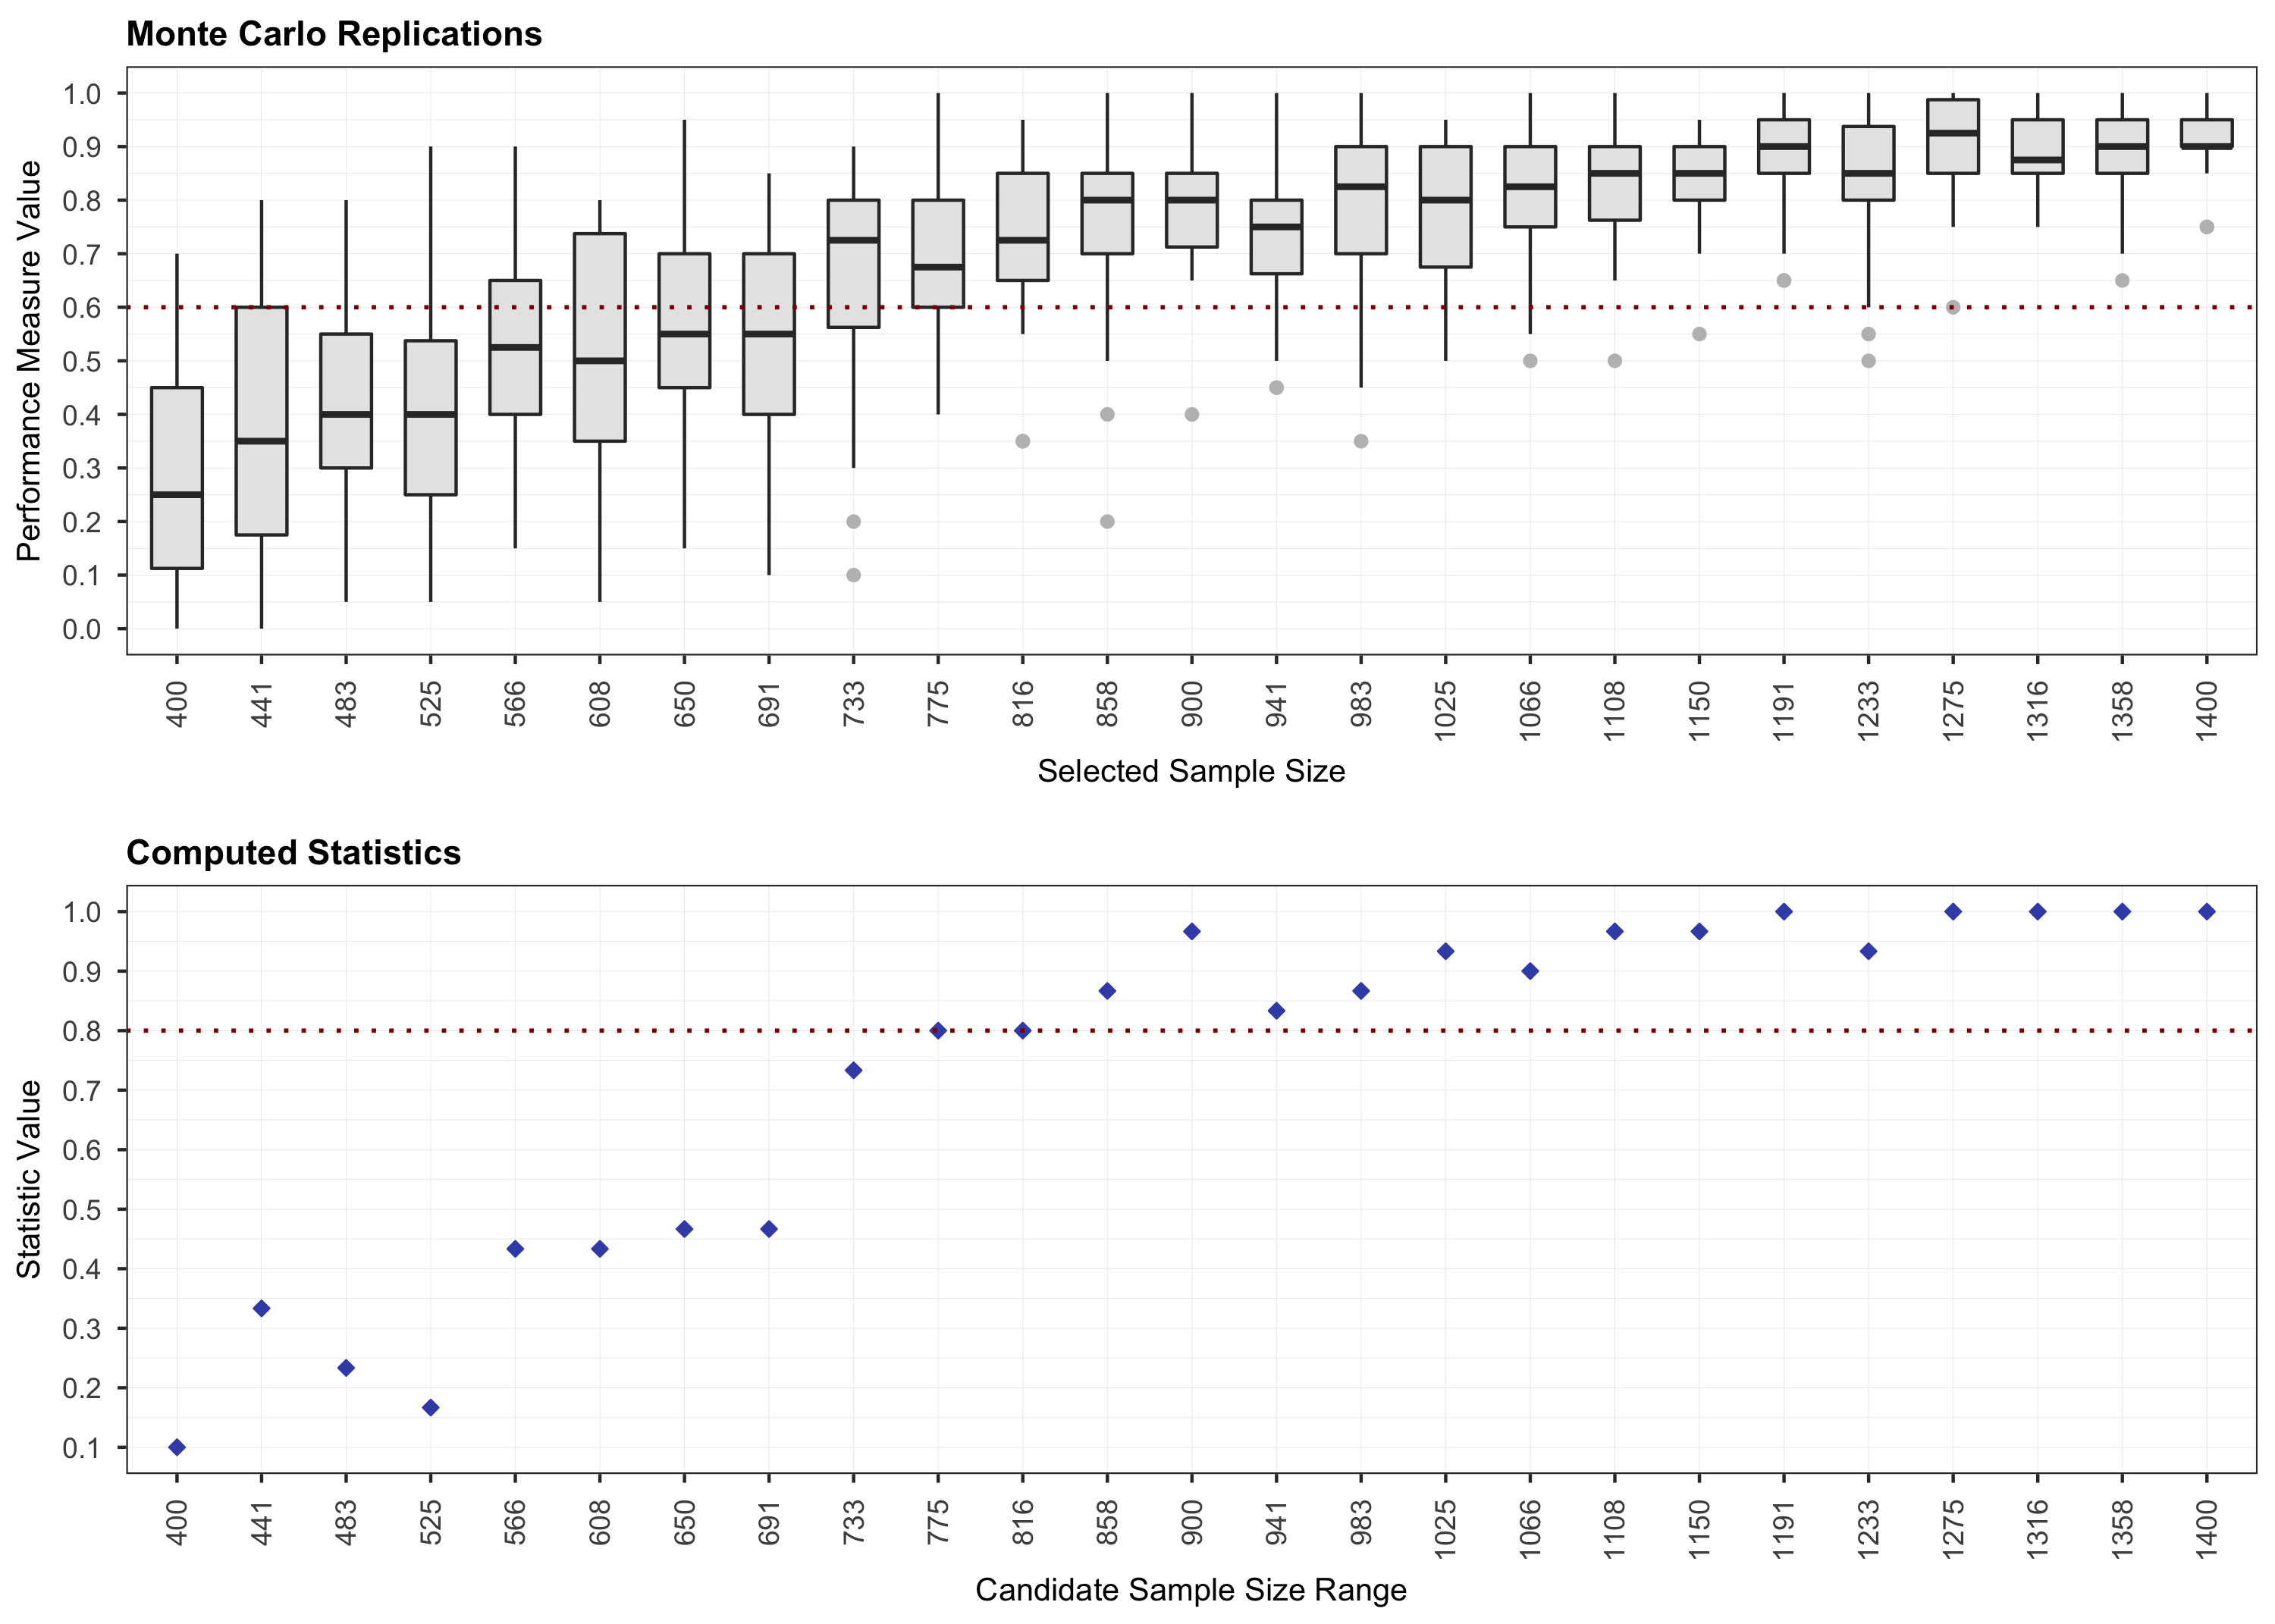
starts with a Monte Carlo simulation step for computing the outcome at
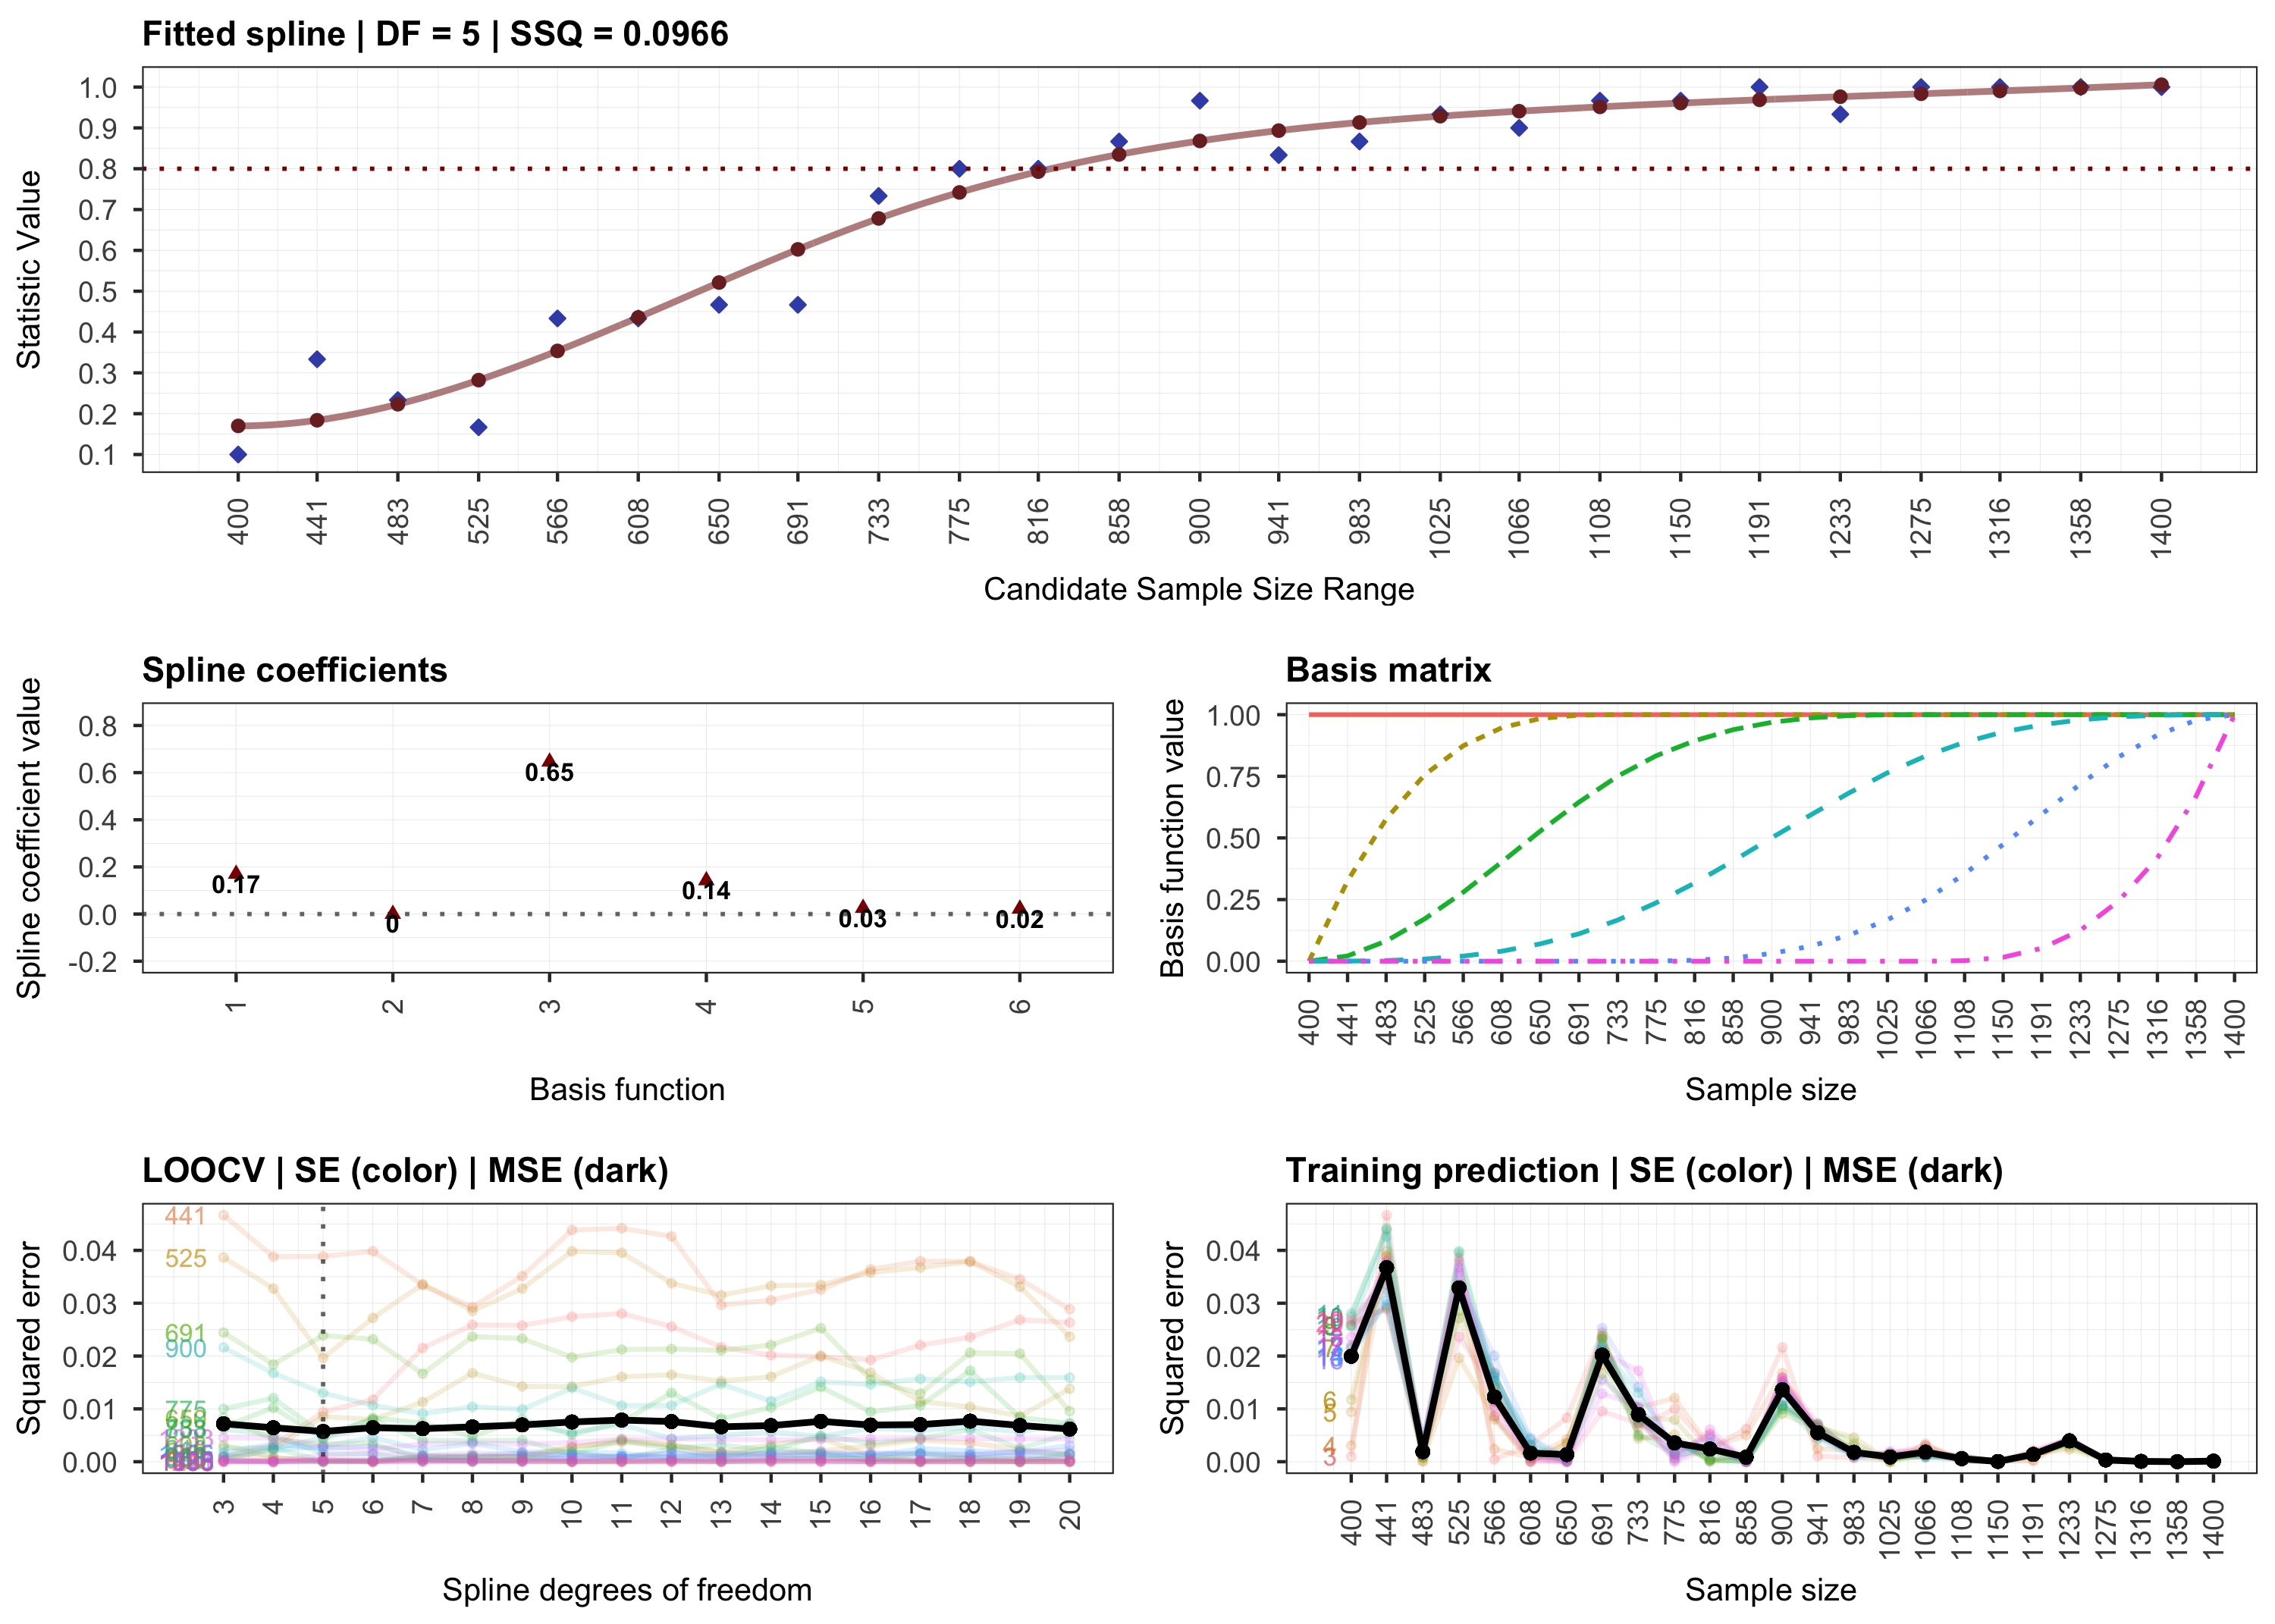
various sample sizes. Then, it continues with a monotone curve-fitting
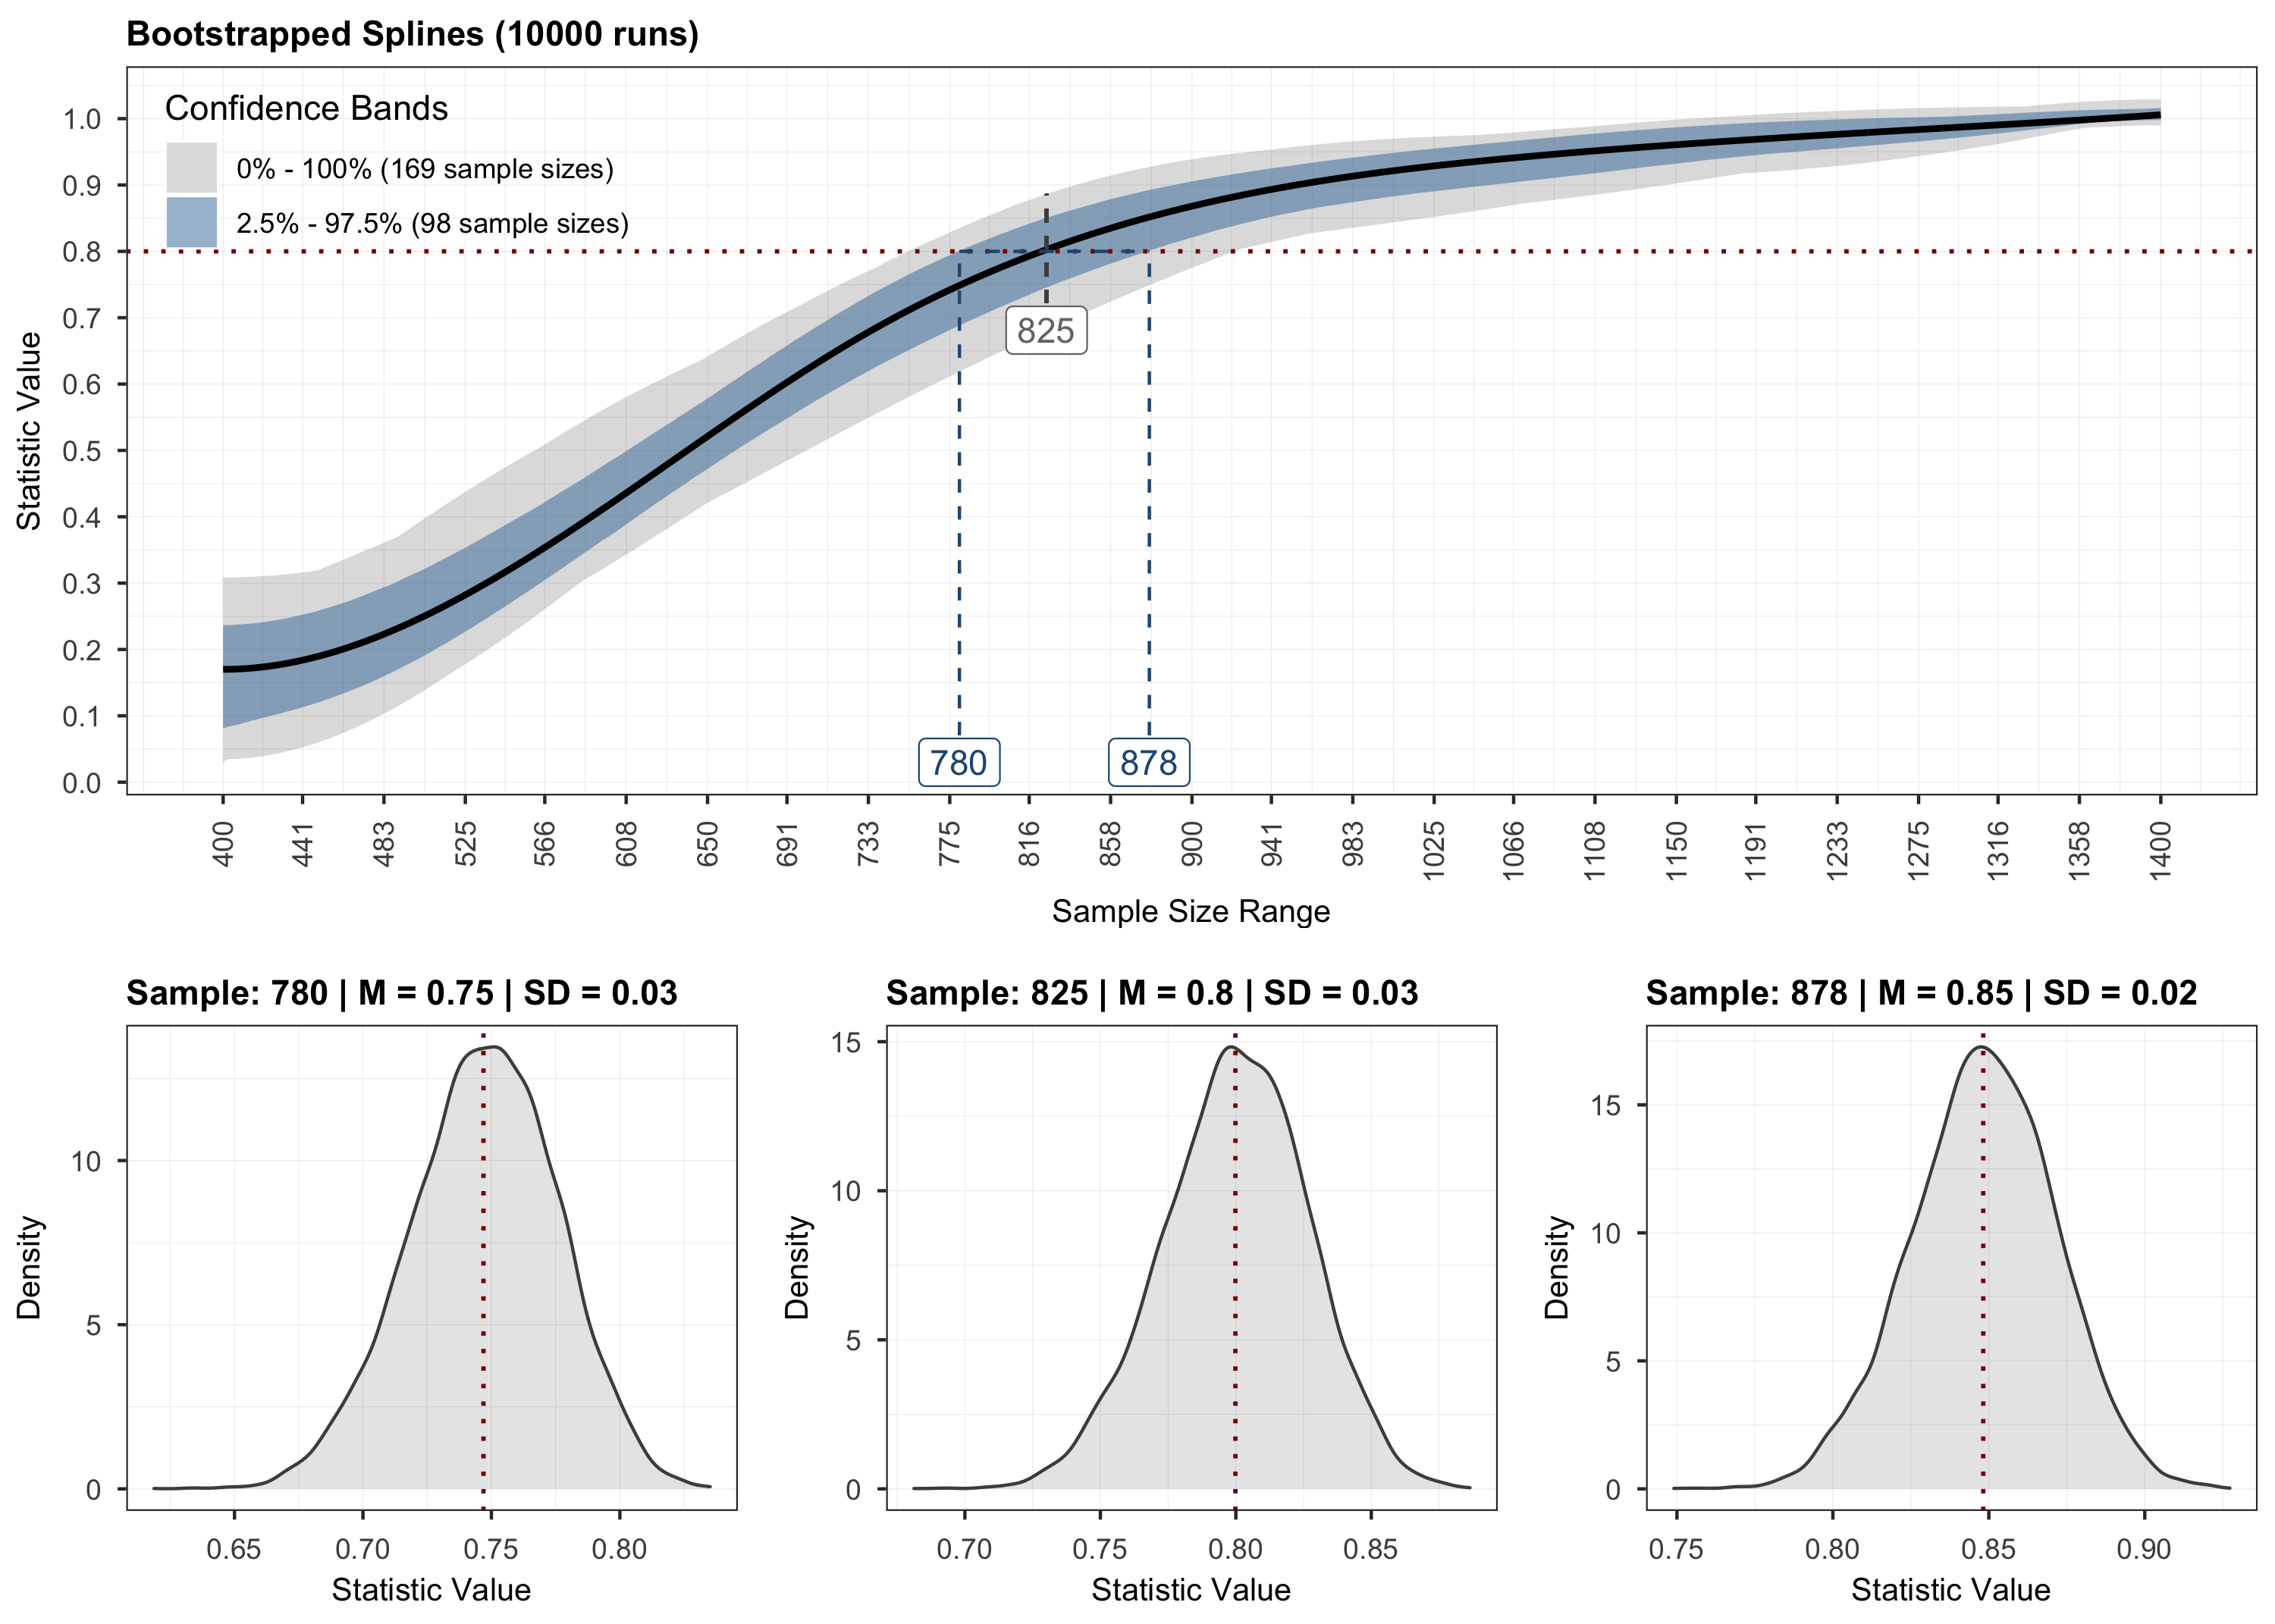
step for interpolating the outcome. The final step employs stratified
bootstrapping to quantify the uncertainty around the fitted curve.
Check out the documentation and tutorials at
<h3>
    <a href="https://powerly.dev">powerly.dev</a>
</h3>install.packages("powerly")remotes::install_github("mihaiconstantin/powerly")The code block below illustrates the main function in the package.
For more information, see the documentation ?powerly, or
check out the tutorials at powerly.dev.
# Suppose we want to find the sample size for observing a sensitivity of `0.6`
# with a probability of `0.8`, for a GGM true model consisting of `10` nodes
# with a density of `0.4`.
# We can run the method for an arbitrarily generated true model that matches
# those characteristics (i.e., number of nodes and density).
results <- powerly(
range_lower = 300,
range_upper = 1000,
samples = 30,
replications = 20,
measure = "sen",
statistic = "power",
measure_value = .6,
statistic_value = .8,
model = "ggm",
nodes = 10,
density = .4,
cores = 2,
verbose = TRUE
)
# Or we omit the `nodes` and `density` arguments and specify directly the edge
# weights matrix via the `model_matrix` argument.
# To get a matrix of edge weights we can use the `generate_model()` function.
true_model <- generate_model(type = "ggm", nodes = 10, density = .4)
# Then, supply the true model to the algorithm directly.
results <- powerly(
range_lower = 300,
range_upper = 1000,
samples = 30,
replications = 20,
measure = "sen",
statistic = "power",
measure_value = .6,
statistic_value = .8,
model = "ggm",
model_matrix = true_model, # Note the change.
cores = 2,
verbose = TRUE
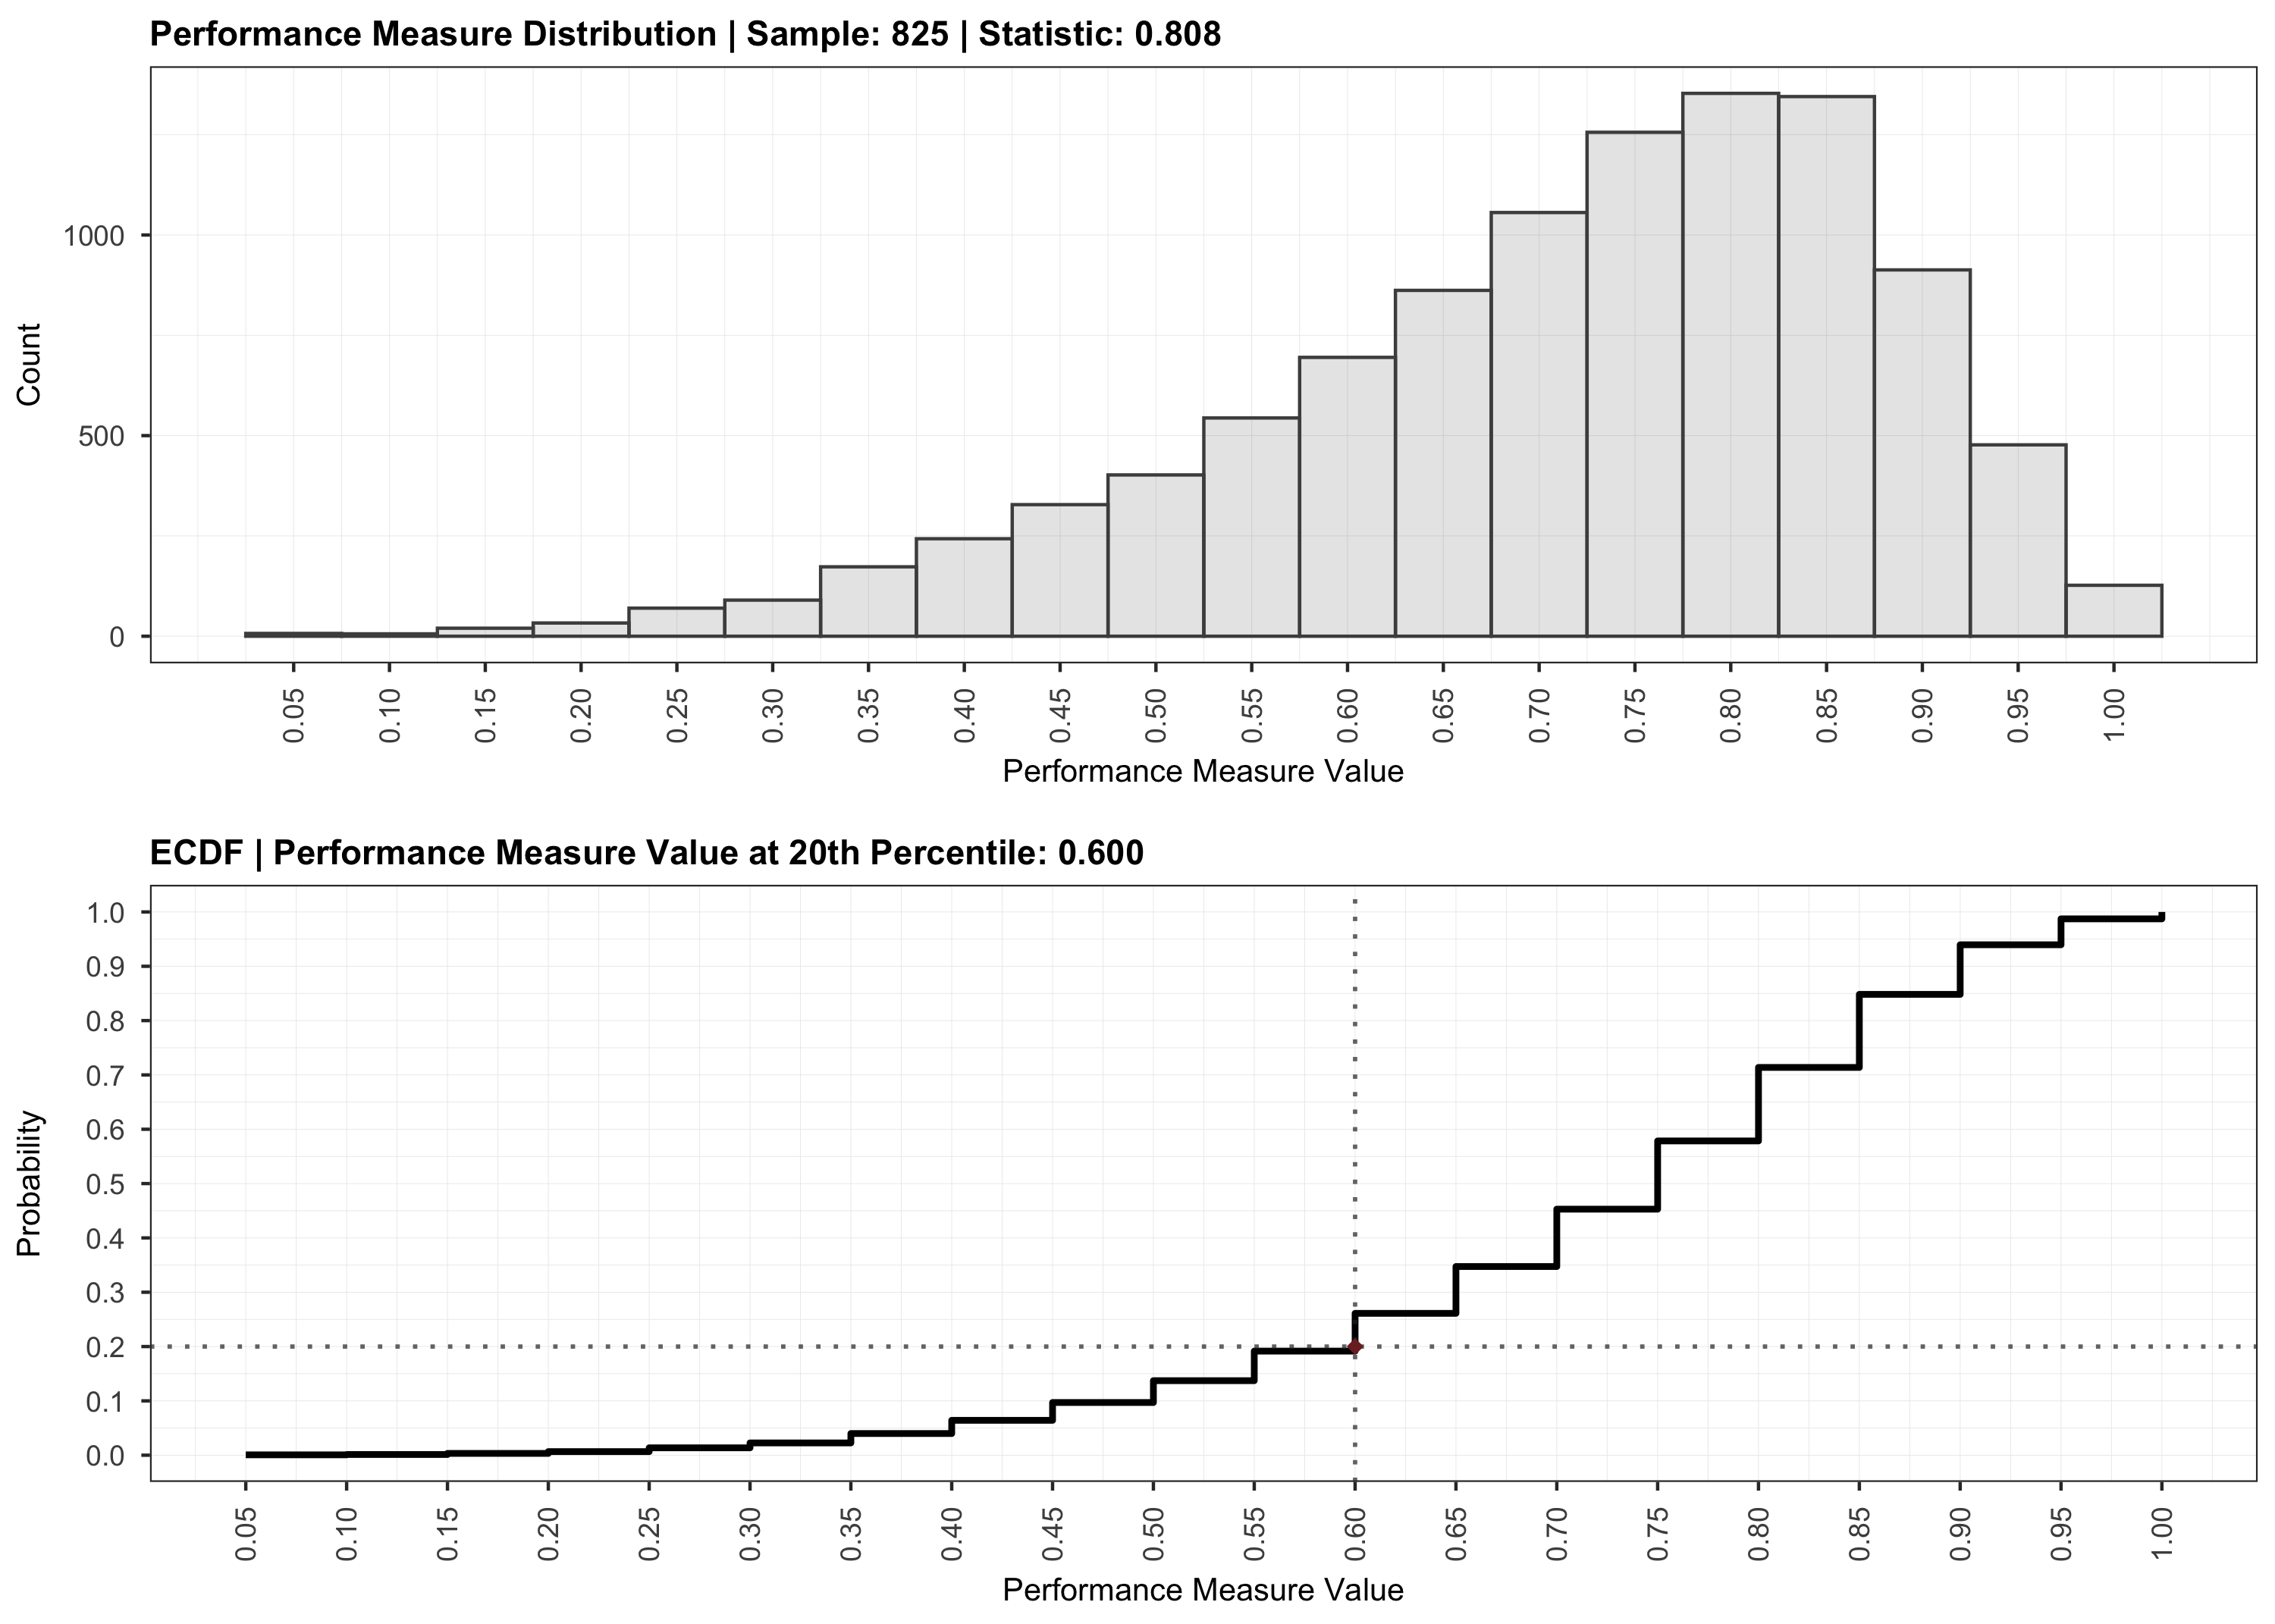
)To validate the results of the analysis, we can use the
validate() method. For more information, see the
documentation ?validate.
# Validate the recommendation obtained during the analysis.
validation <- validate(results)
To visualize the results, we can use the plot function
and indicate the step that should be plotted.
# Step 1.
plot(results, step = 1)
# Step 2.
plot(results, step = 2)
# Step 3.
plot(results, step = 3)
# Validation.
plot(validation)

The code in this repository is licensed under the MIT license.
To use powerly please cite: - Constantin, M. A.,
Schuurman, N. K., & Vermunt, J. (2021). A General Monte Carlo Method
for Sample Size Analysis in the Context of Network Models. PsyArXiv. https://doi.org/10.31234/osf.io/j5v7u