

![]()

UPDATE: robvis now exists as a web-app, aimed at those
who are not familiar with R or who want to explore the package’s
functionality before installing it locally.
The robvis package takes the summary table from
risk-of-bias assessments, converts it to tidy data, and produces summary
plots formatted according to the assessment tool used.
First ensure you have the devtools package
installed:
install.packages("devtools")
library(devtools)
Then, to install:
install_github("mcguinlu/robvis")
library(robvis)
To update the package, run the
install_github("mcguinlu/robvis") command again.
To load your own data from a .csv file:
mydata <- read.csv("path/to/mydata.csv", header = TRUE)To help users explore robvis, we have included example
datasets in the package, one for each of the tool templates that
currently exist within the package. The data_rob2 dataset
(view
it here), which contains example risk-of-bias assessments performed
using the RoB2.0 tool for randomized controlled trials, is used to
create the plots in subsequent sections.
The package contains two plotting functions:
Returns a ggplot object displaying a weighted barchart of the risk of bias of included studies across the domains of the specified tool.
summary_rob <- rob_summary(data = data_rob2, tool = "ROB2")
summary_rob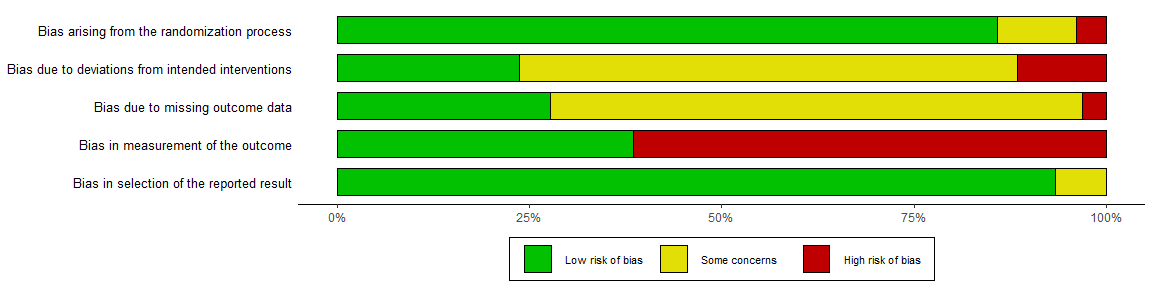
Returns a ggplot object displaying a “traffic light plot”, displaying the risk of bias judgment in each domain for each study.
trafficlight_rob <- rob_traffic_light(data = data_rob2, tool = "ROB2")
trafficlight_rob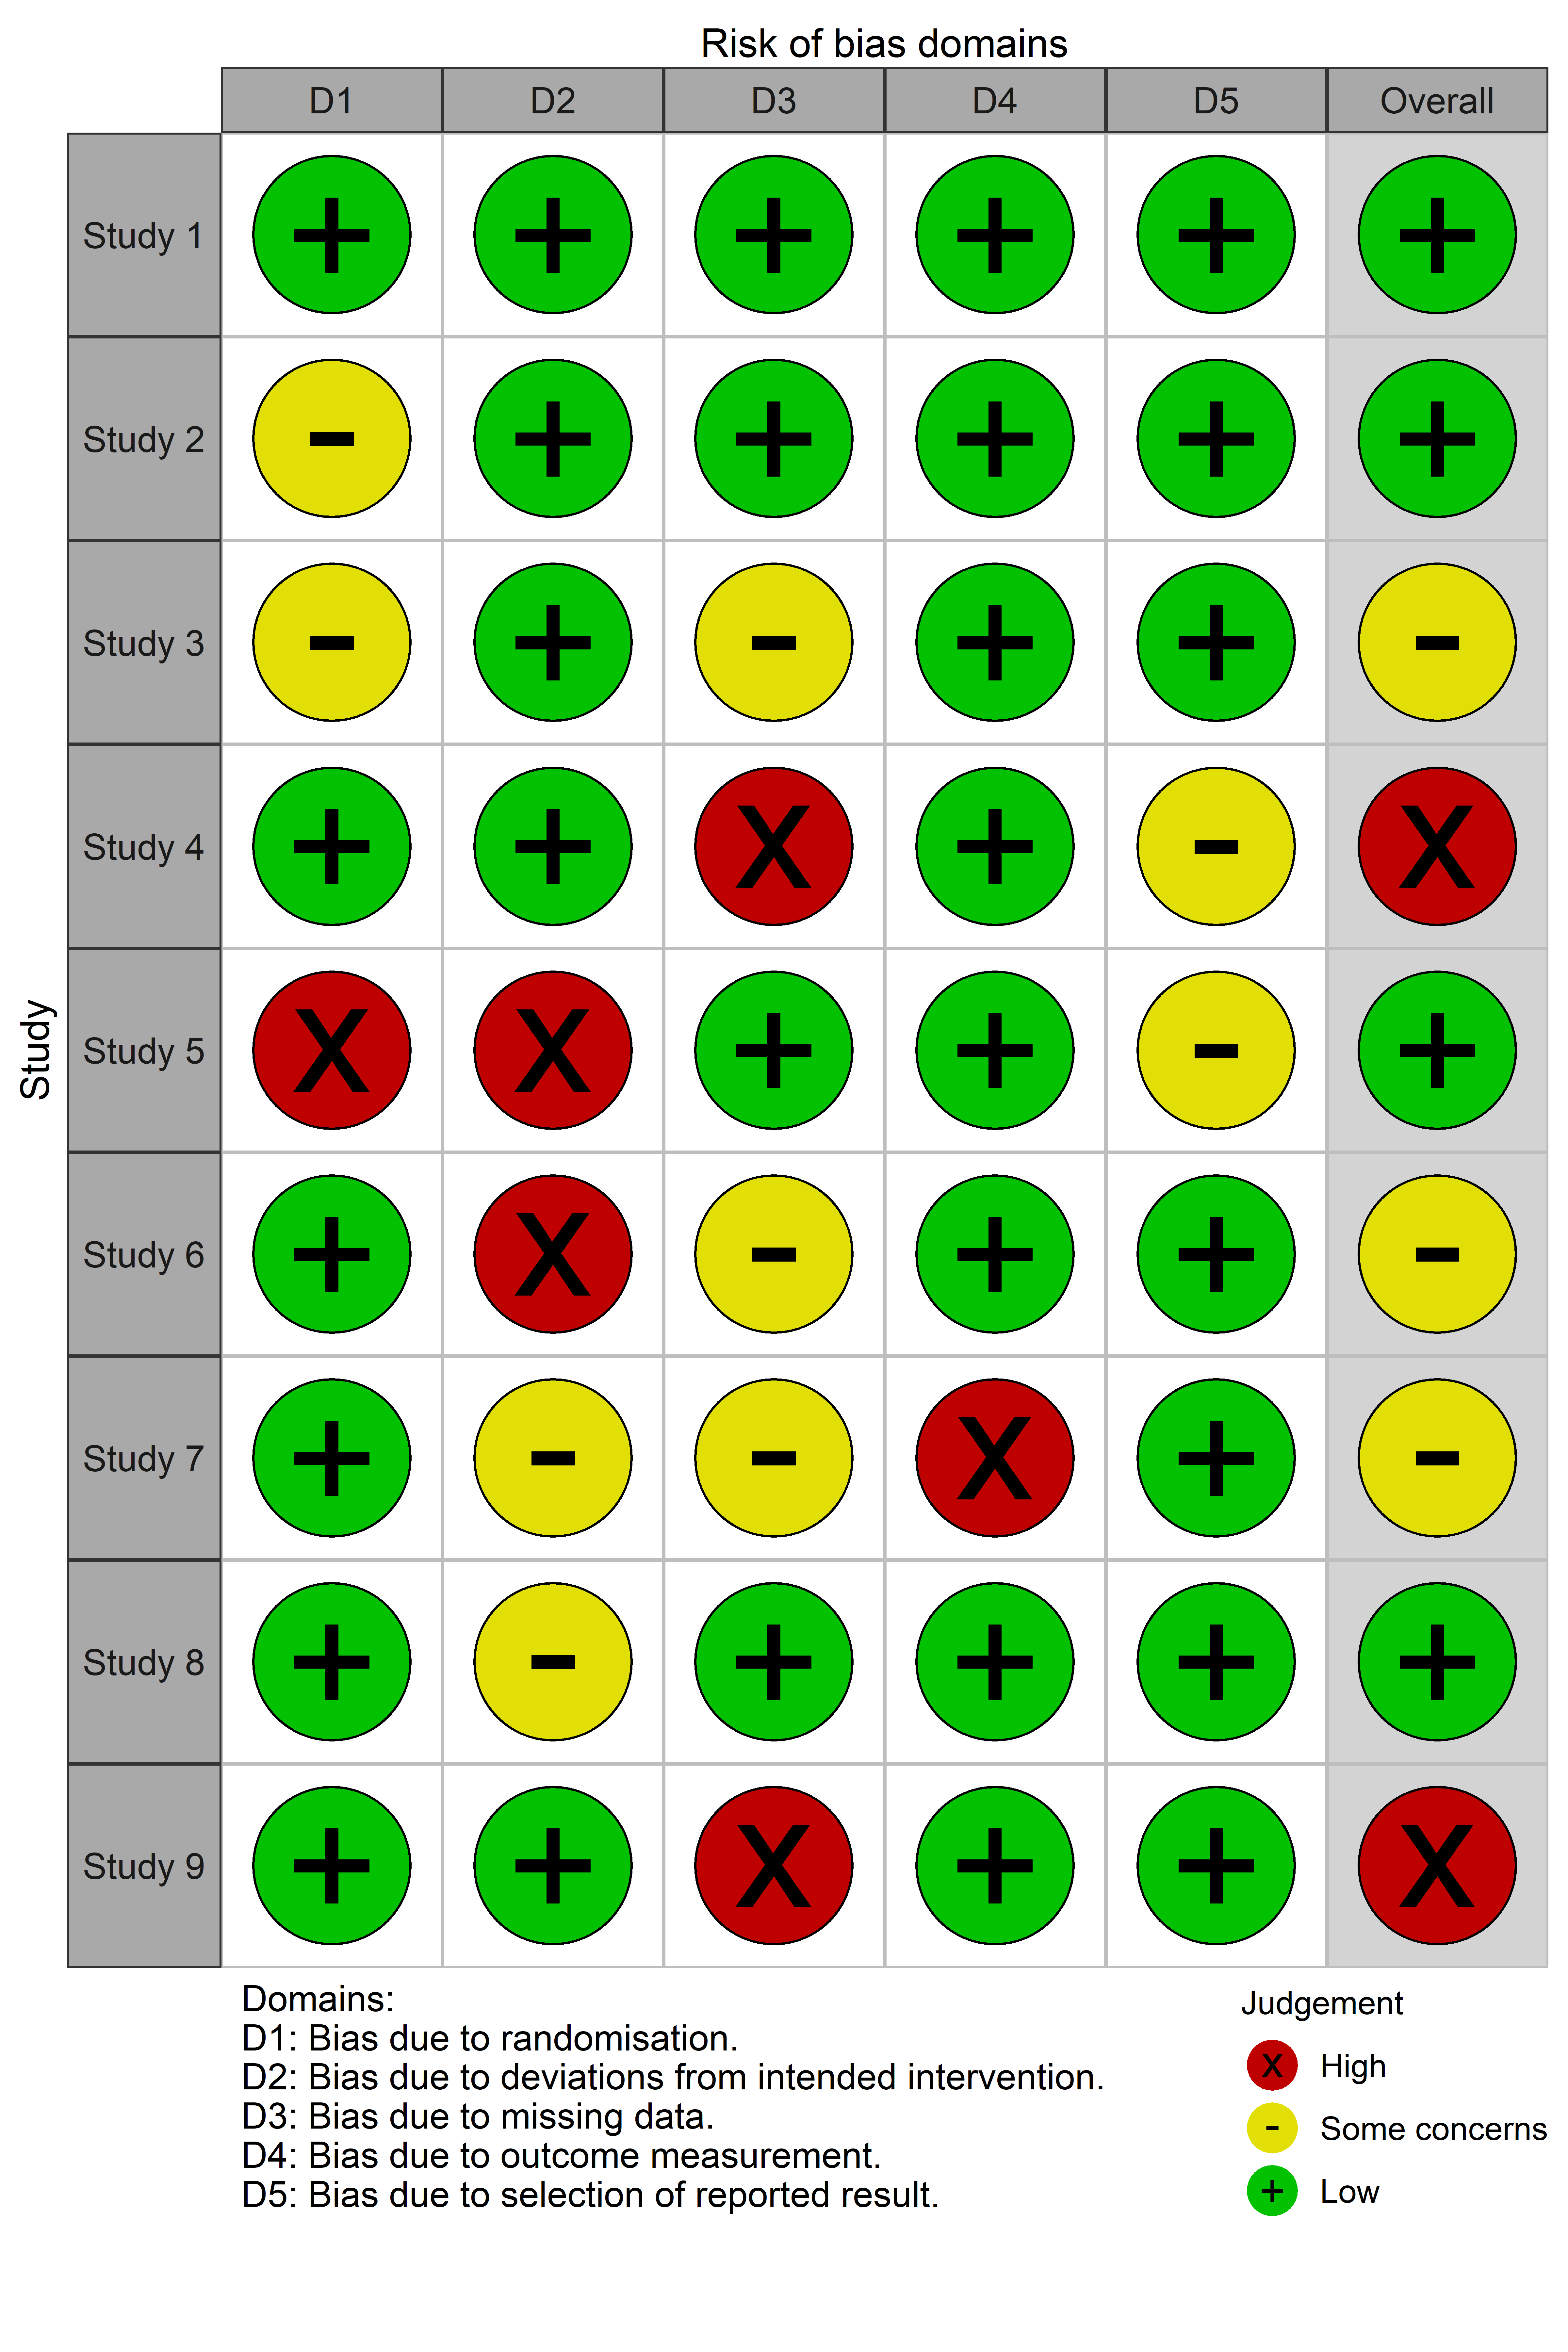
Outputs a list of the risk of bias assessment tools for which a template currently exists in rob_summary(). We expect this list to be updated in the near future to include tools such as ROBIS (tool for assessing risk of bias in systematic reviews).
rob_tools()
[1] "ROB2"
[1] "ROBINS-I"
[1] "QUADAS-2"
[1] "ROB1"The colour argument of both plotting functions allows
users to select from two predefined colour schemes (“cochrane” or
“colourblind”) or to define their own palette by providing a vector of
hex codes.
For example, to use the predefined “colourblind” palette:
summary_rob <- rob_summary(data = data_rob2, tool = "ROB2", colour = "colourblind")
summary_rob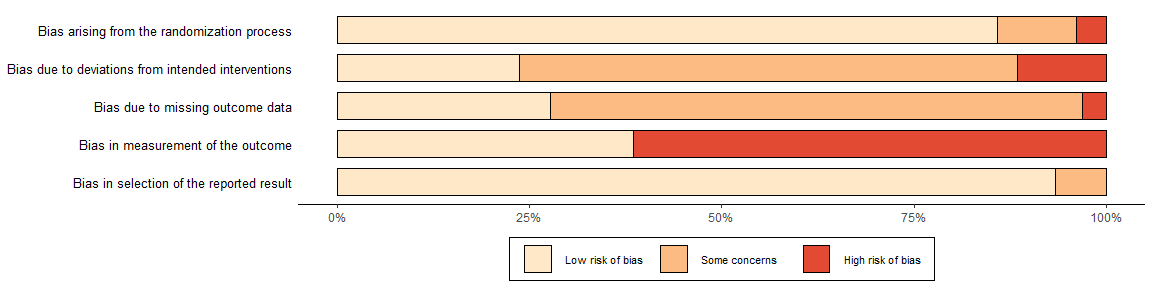
And to define your own colour scheme:
summary_rob <- rob_summary(data = data_rob2, tool = "ROB2", colour = c("#f442c8","#bef441","#000000"))
summary_rob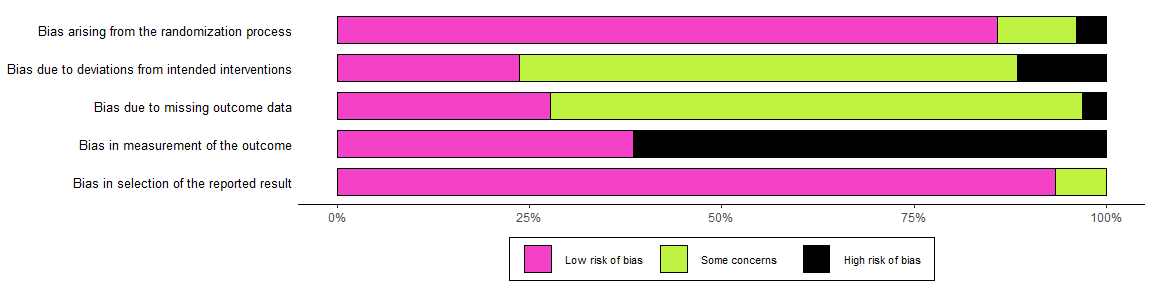
By default, the rob_summary() function creates a barplot
weighted by some measure of a study’s precision. This can be prevented
using the “weighted” argument. For example, compare the following two
plots:
summary_rob <- rob_summary(data = data_rob2, tool = "ROB2")
summary_rob
summary_rob <- rob_summary(data = data_rob2, tool = "ROB2", weighted = FALSE)
summary_rob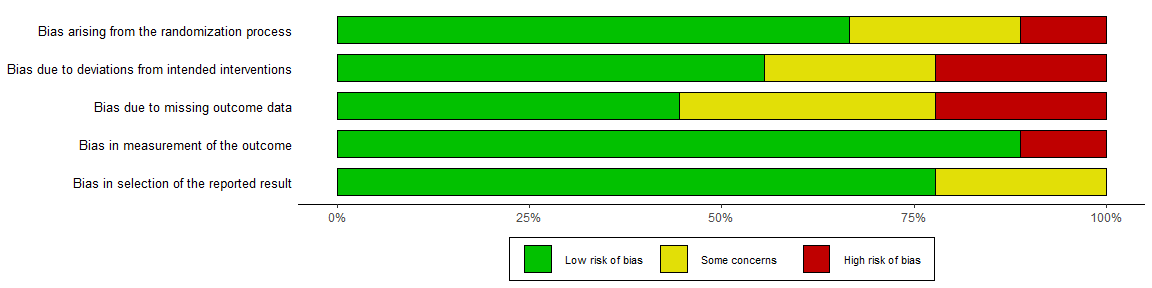
Finally, because the output (summary_rob and
trafficlight_rob in the examples above) is a ggplot2
object, it is easy to adjust the plot to your own preferences.
For example, to add a title to the unweighted RoB2.0 plot created above:
library(ggplot2)

summary_rob +
  ggtitle("Summary of RoB2.0 assessments")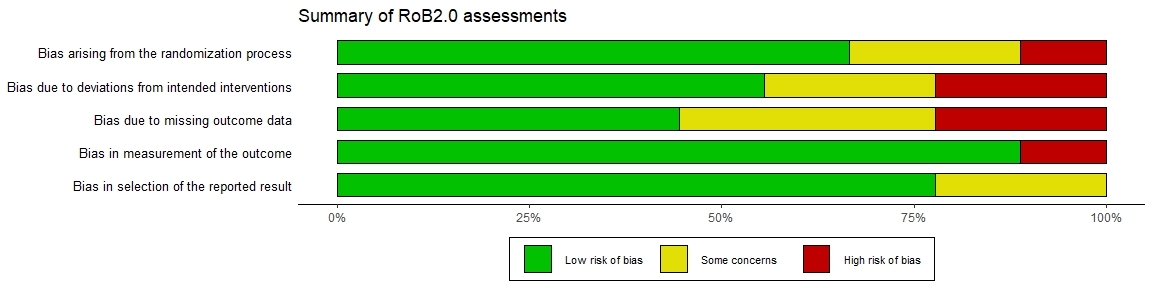
Please note that the ‘robvis’ project is released with a Contributor Code of Conduct. By contributing to this project, you agree to abide by its terms.
This project is licensed under the MIT License - see the LICENSE.md file for details.
rob_summary() function was based on code forwarded
by a colleague. I recently discovered that this code was adapted from
that presented in the wonderful “Doing
Meta-Analysis in R” guide, so I would like to acknowledge the
authors here.ggplot2 coding issues.robvis hex sticker.