Wajid Jawaid 2017-07-09
Reconstructing ordered ontogenic trajectories provides methods for:
The main goal of roots is to infer plausible developmental journeys guided by the user.
library(devtools)
install_github("wjawaid/roots")Here I take the mouse adult haematopoietic data from Nestorowa et al.. Data is downloaded and processed using the goggles() function as below.
library(roots)
## Load data
blood <- read.table("http://blood.stemcells.cam.ac.uk/data/norm_counts_nestorowa_data.txt",
sep = " ")
cellNames <- read.table("http://blood.stemcells.cam.ac.uk/data/cell_names_nestorowa_data.txt",
sep = " ", stringsAsFactors = FALSE)[,1]
rownames(blood) <- gsub("LT\\.", "LT-", cellNames)
geneNames <- read.table("http://blood.stemcells.cam.ac.uk/data/gene_names_nestorowa_data.txt",
sep = " ", stringsAsFactors = FALSE)[,1]
colnames(blood) <- geneNames
blood <- as.matrix(blood)
rm(cellNames, geneNames)
## Load metadata
meta <- read.csv("http://blood.stemcells.cam.ac.uk/data/wj_out_jd.csv")
colnames(meta) <- c("cellType", "index", "name")
rownames(meta) <- meta$name
meta$col <- bglab::ggCol(meta$cellType)
nmeta <- data.frame(col=rep("#00000011", nrow(blood)), stringsAsFactors = FALSE,
row.names = rownames(blood))
nmeta[rownames(meta),"col"] <- meta$col
leg <- data.frame(cell=as.character(unique(meta$cellType)),
col=as.character(unique(meta$col)), stringsAsFactors = FALSE)
legOrd <- c(5, 8, 6, 7, 1, 4, 2, 3)
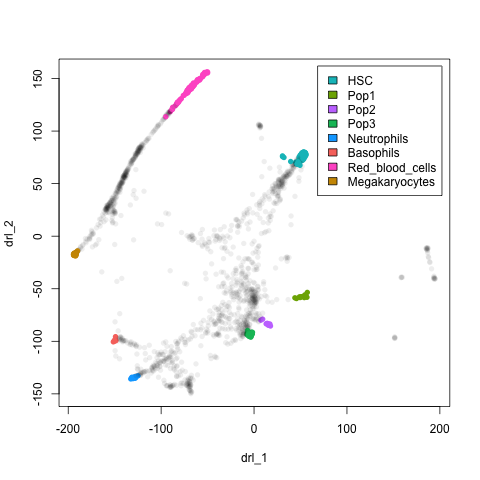
## Analyse
xx <- goggles(blood)
## Plot
plot(xx$l, pch=16, col = nmeta[rownames(xx$l), "col"])
legend("topright", legend = leg$cell[legOrd], fill=leg$col[legOrd], inset=0.02)