An R package that unifies the shiny-based graphical user interfaces from the seasonal and x13story packages and the online adjustment tool on www.seasonal.website.
To install from CRAN, use:
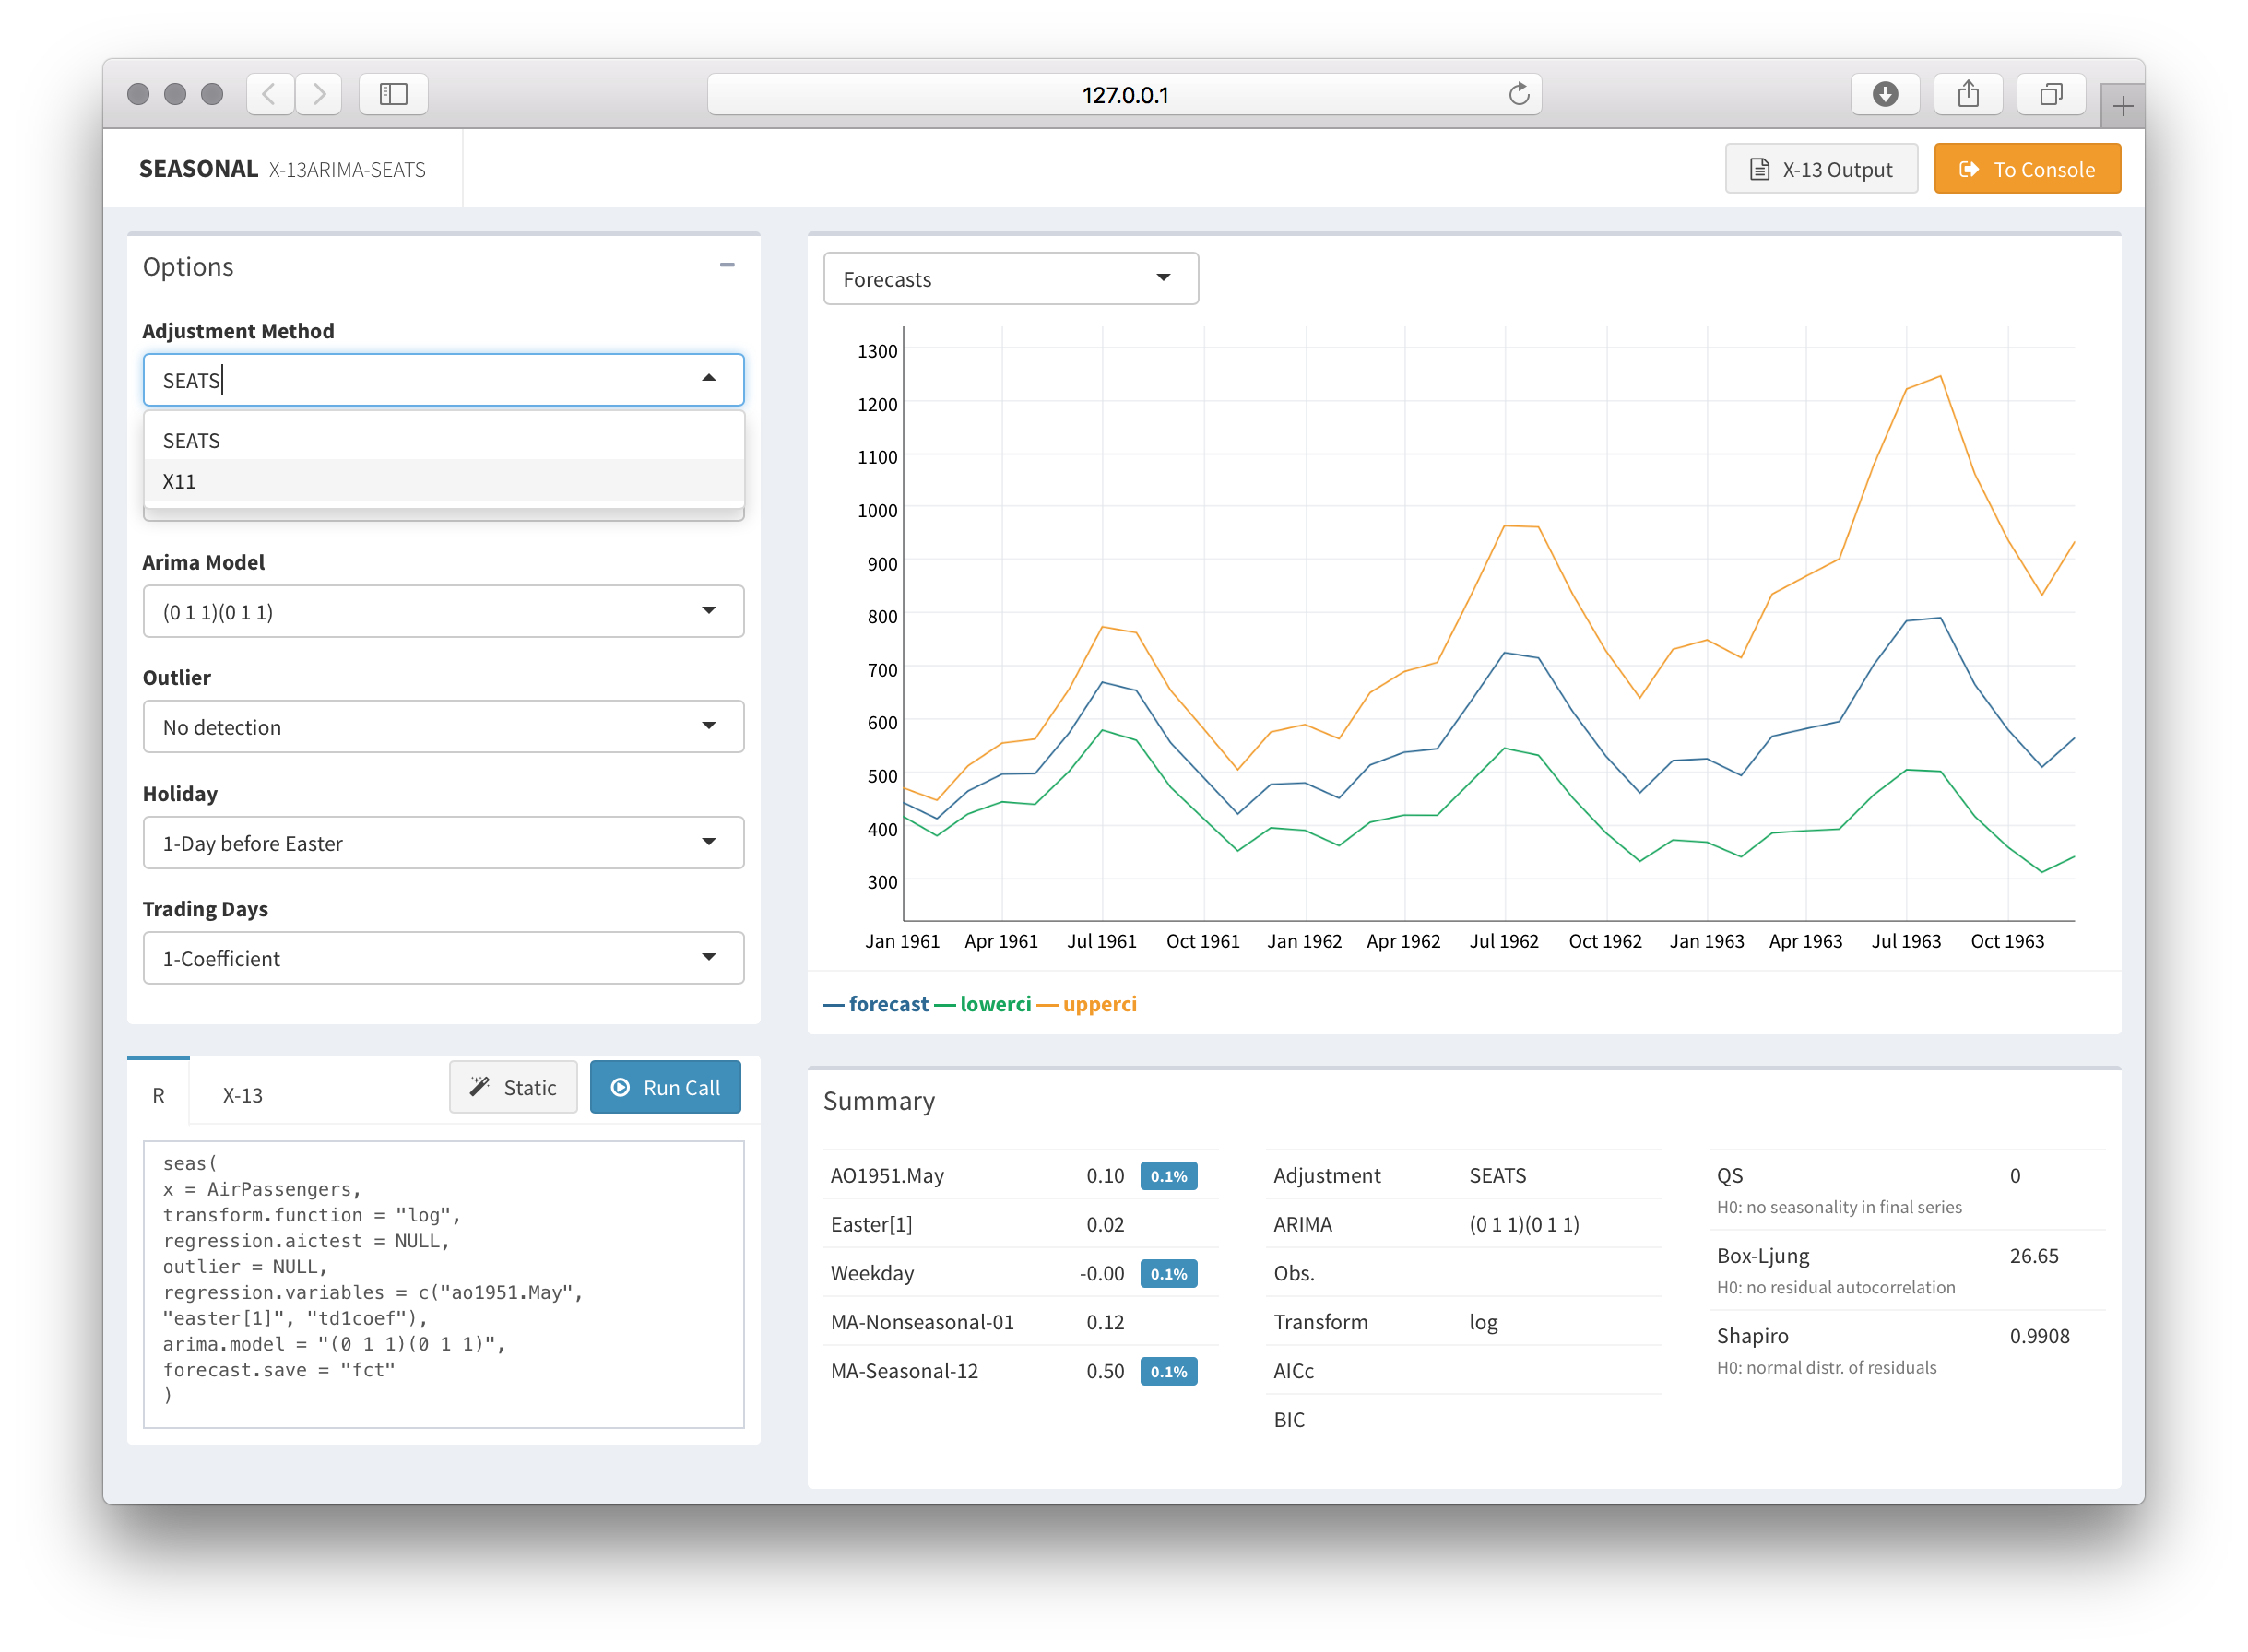
install.packages("seasonalview")The main function of the package is the view function,
which works like the depreciated inspect function in seasonal (which
it replaces). seasonalview
is imported by seasonal, so
loading is not necessary:
library(seasonal)
m <- seas(AirPassengers)
view(m)
If you have the x13story package
installed, you can call the function with the story
argument. This will render an R
Markdown document and produce a story on seasonal
adjustment that can be manipulated interactively.
view(story = "https://raw.githubusercontent.com/christophsax/x13story/master/inst/stories/x11.Rmd")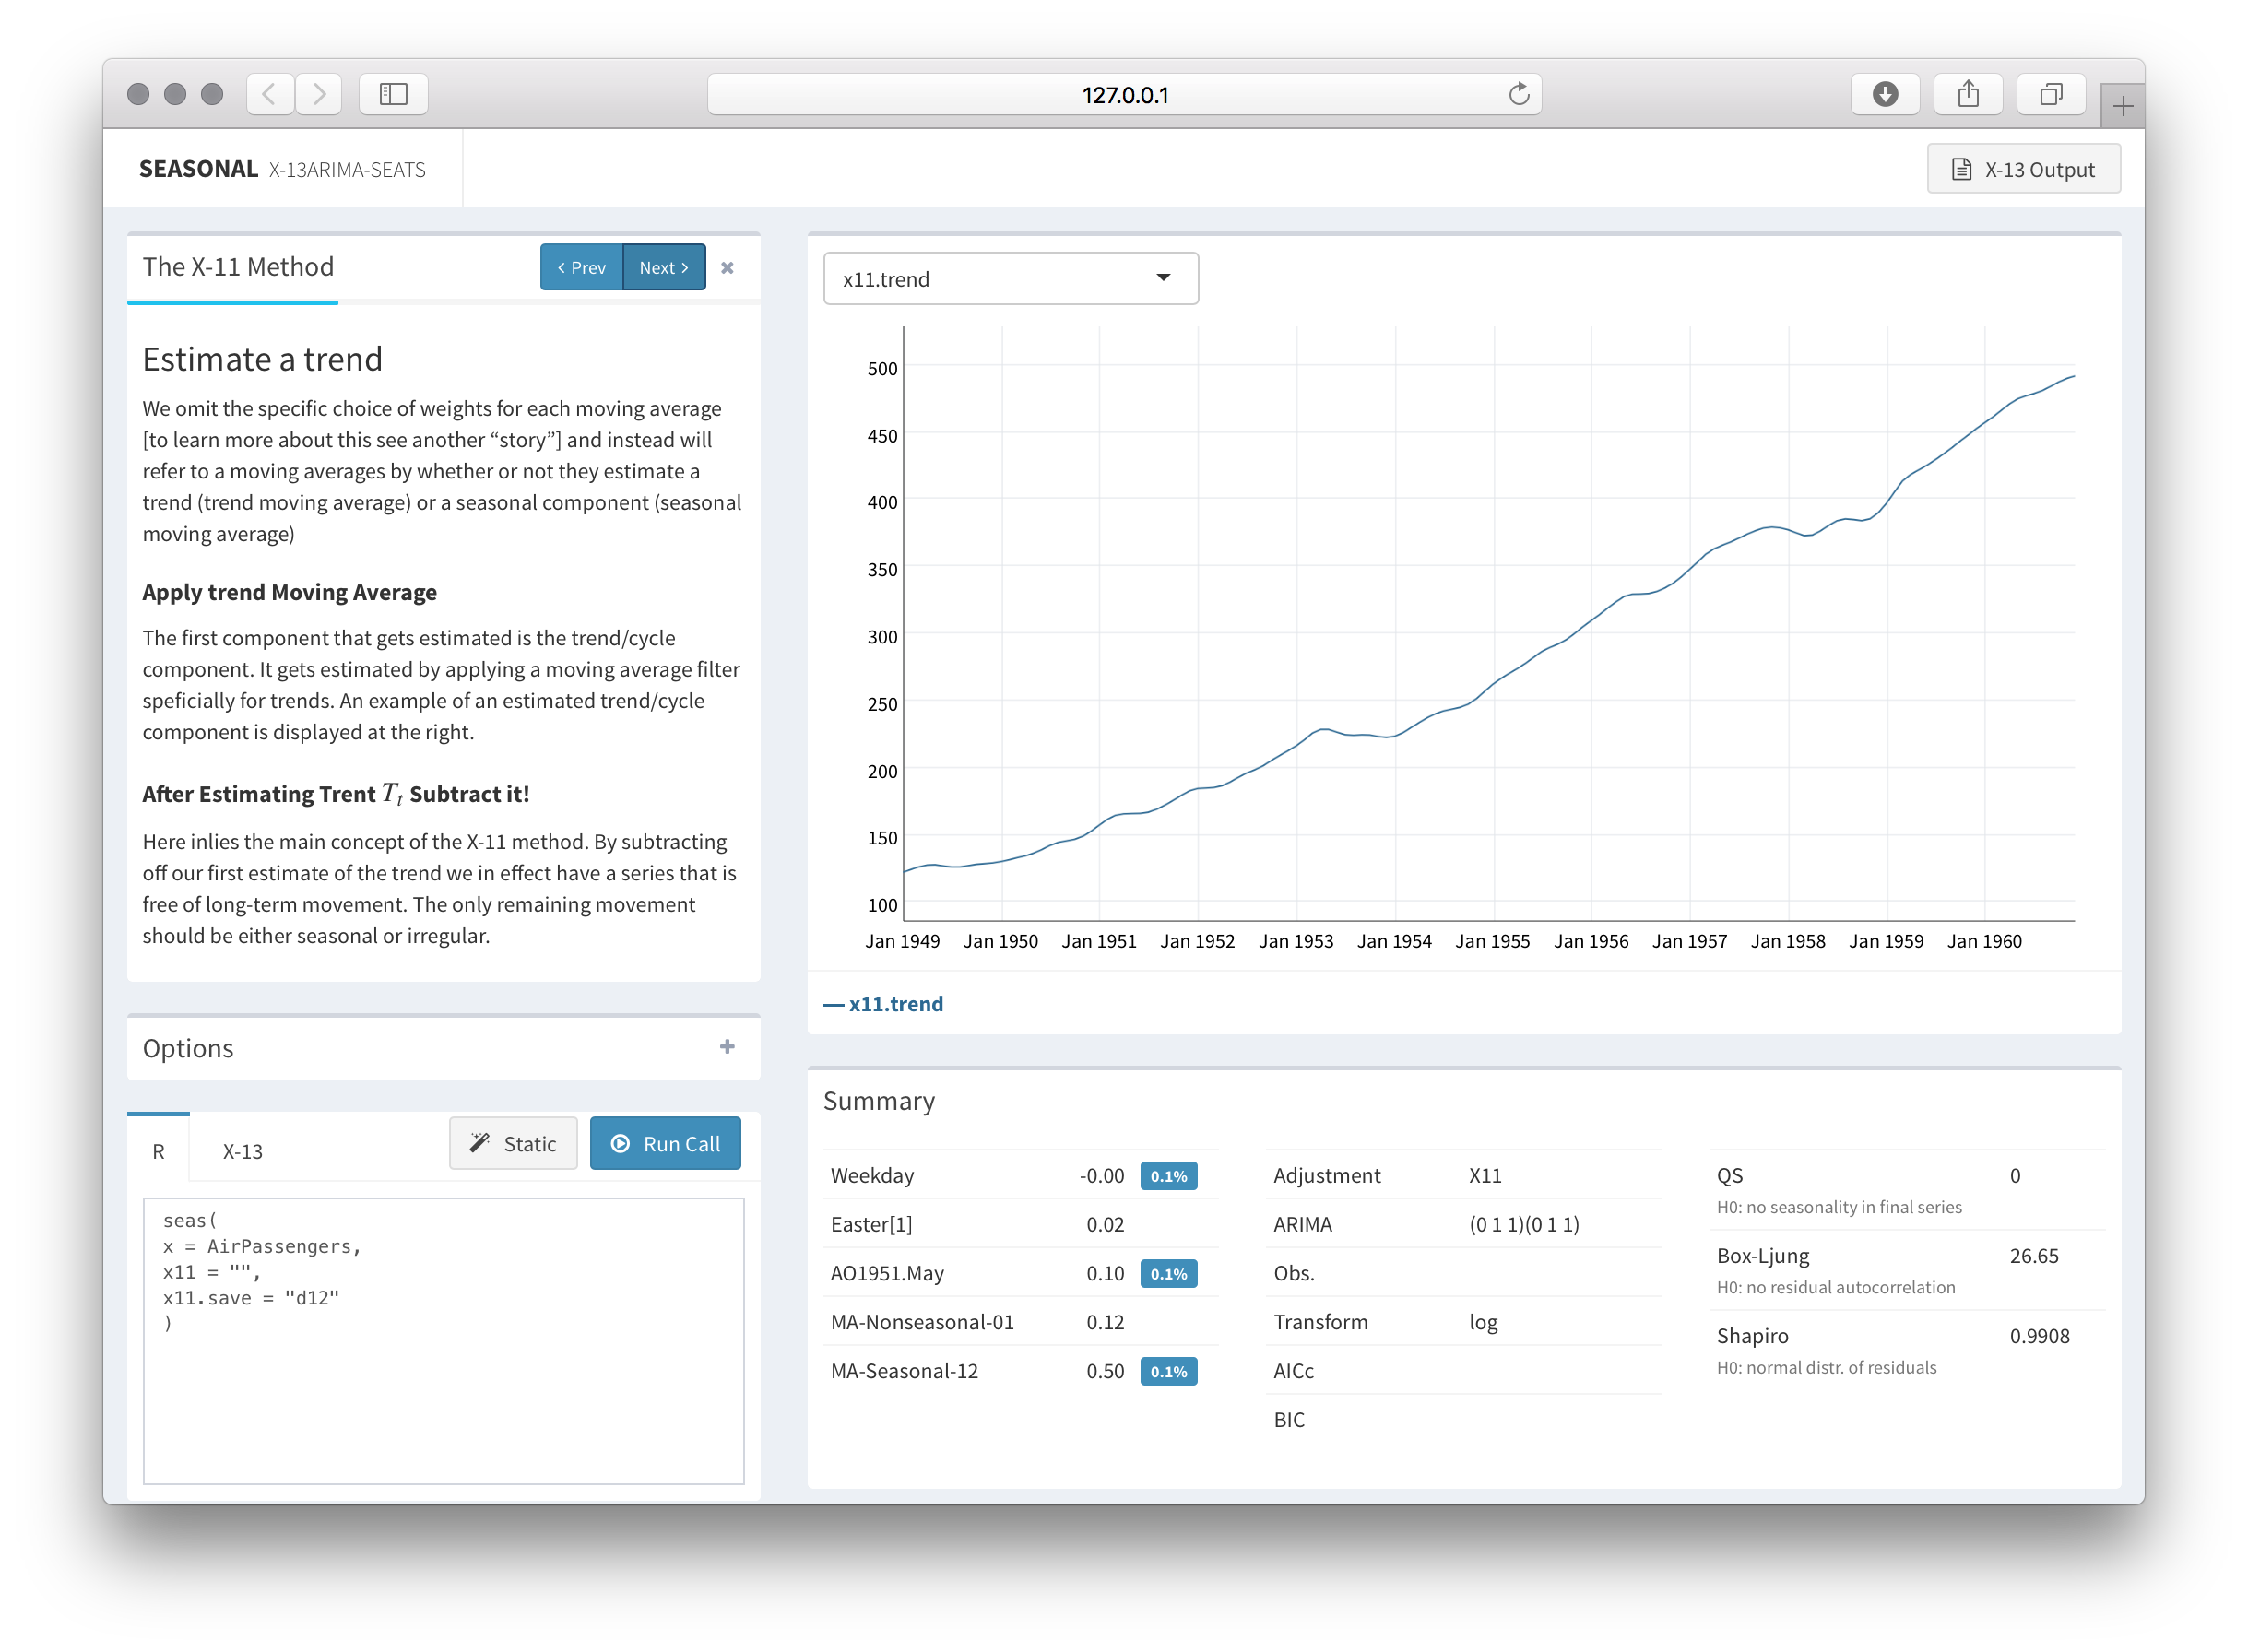
Finally, you can set up a stand-alone seasonal adjustment tool,
either locally or on a server. While itself not very useful, the
standalone function showcases how a local version of www.seasonal.website would look
like:
library(seasonalview)
standalone()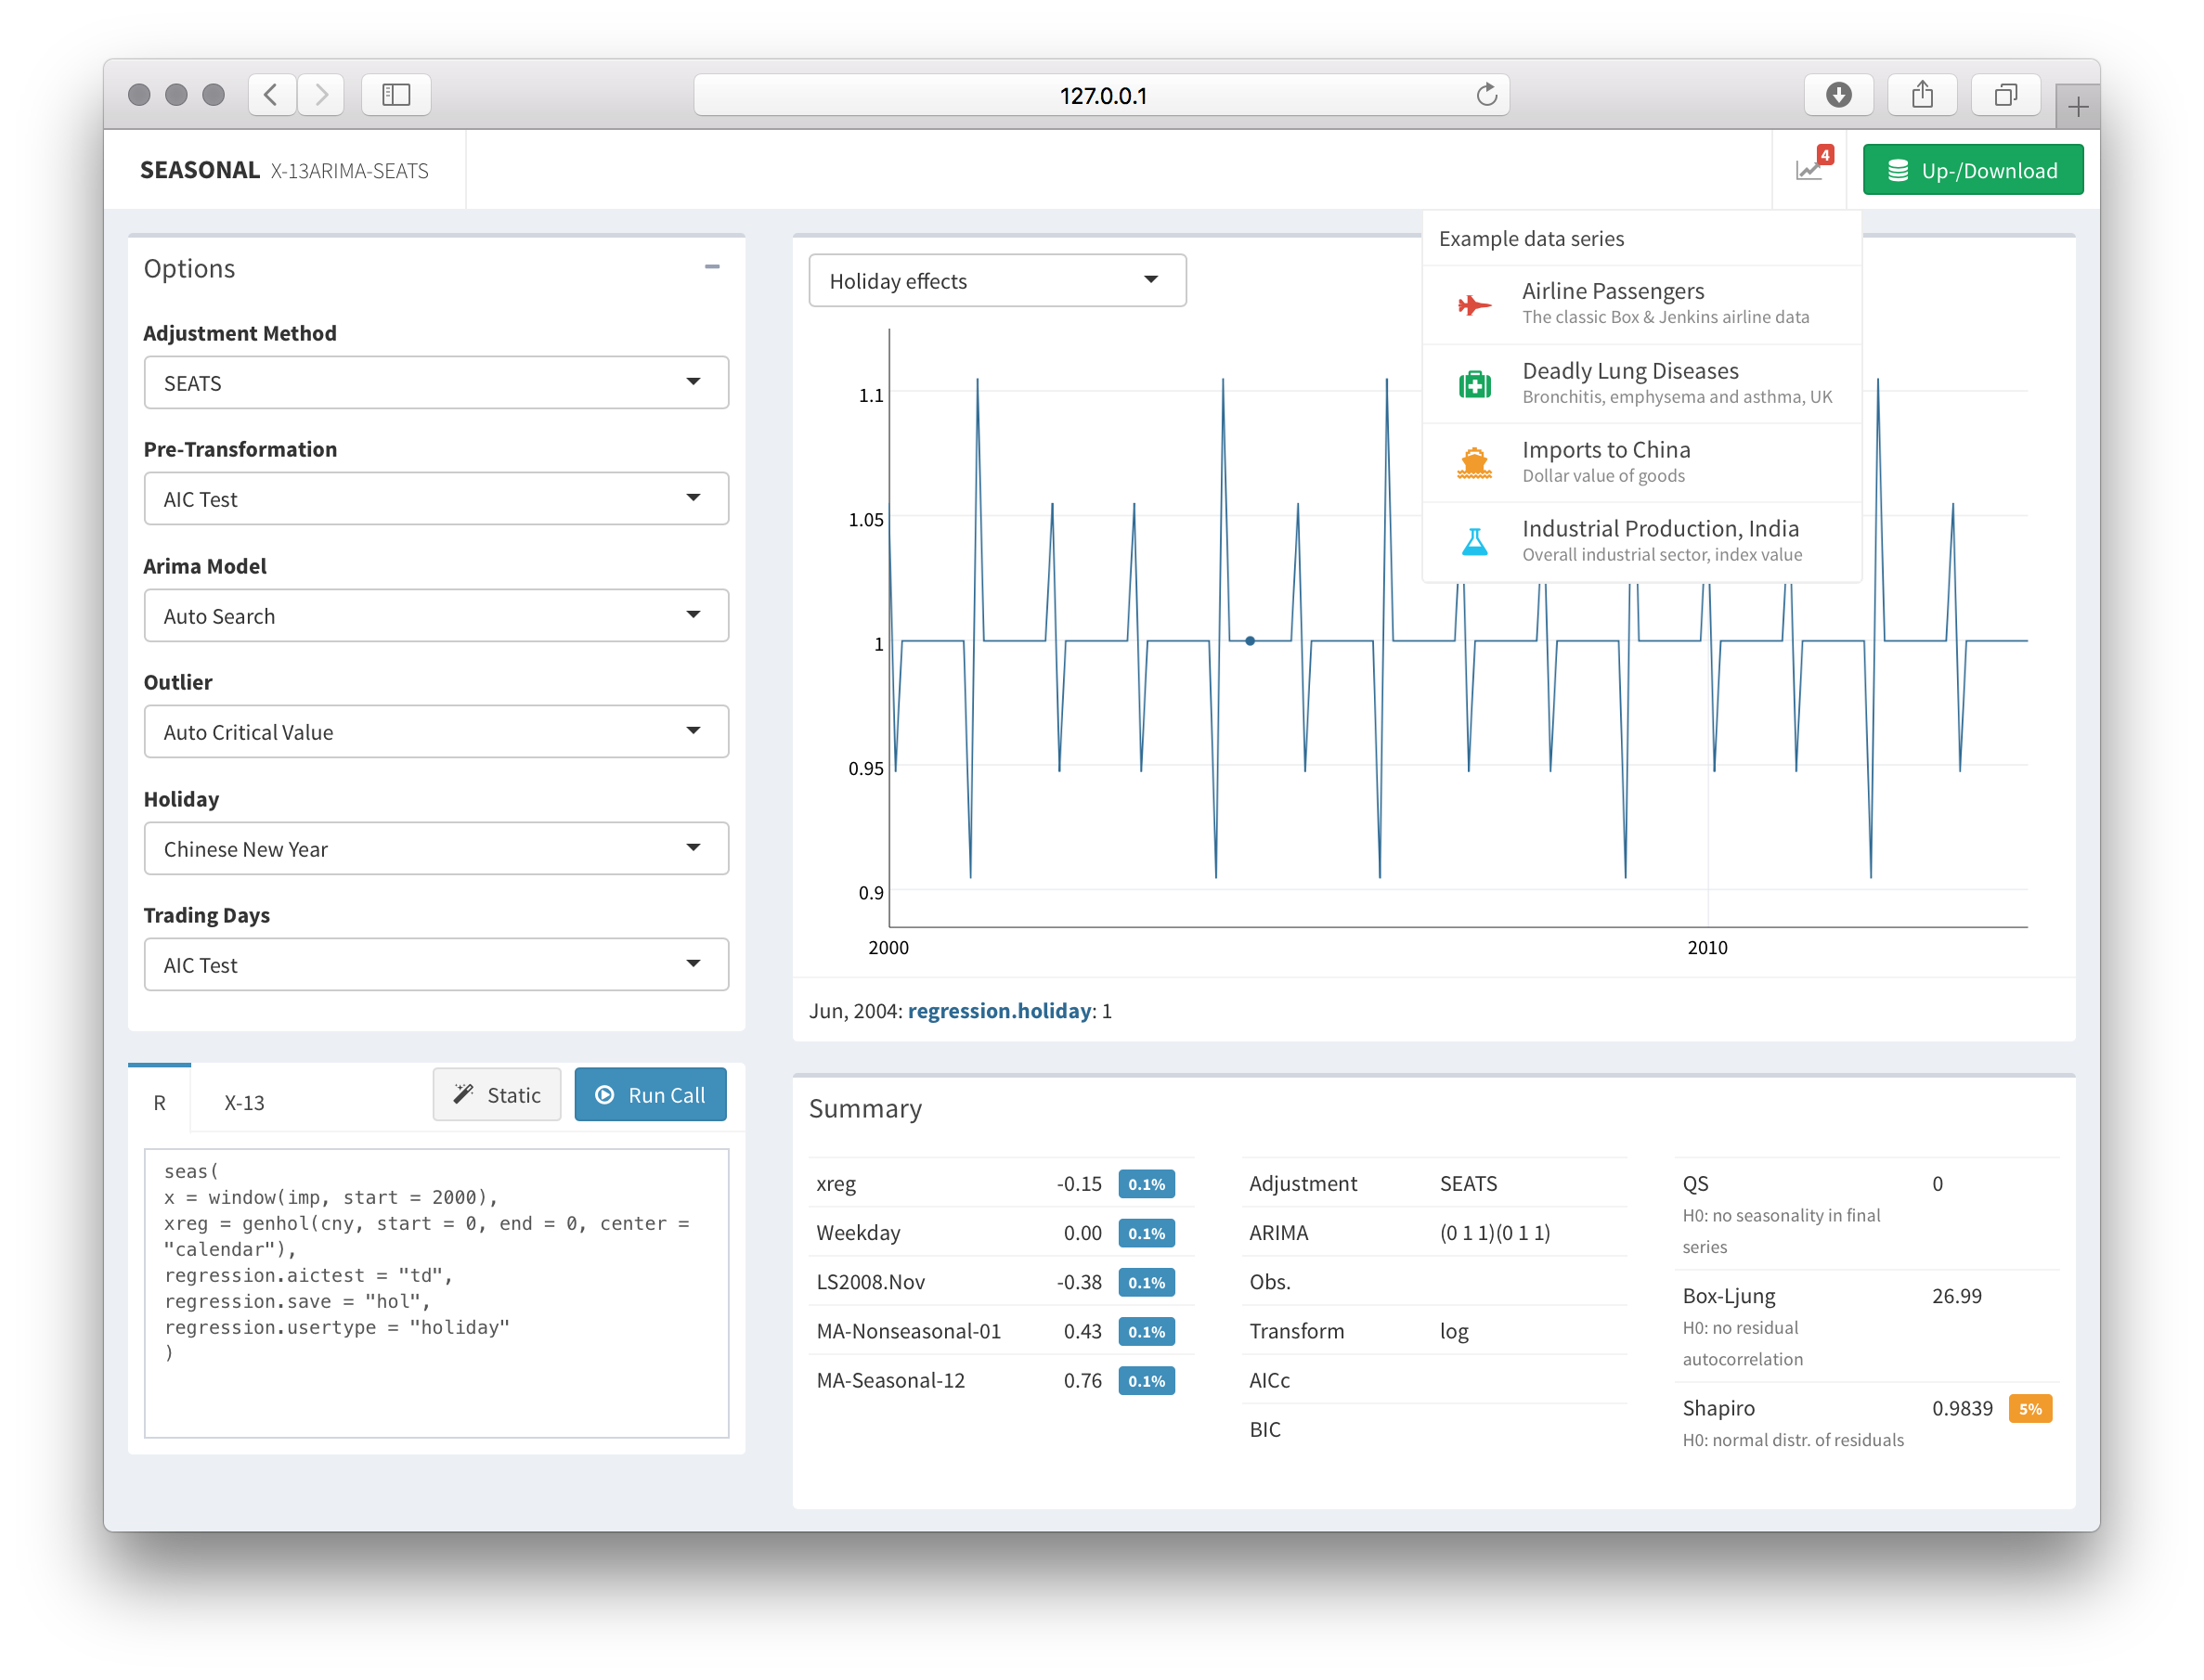
seasonalview is free and open source, licensed under GPL-3. It is built on top of a large number of great open source tools. It uses shiny and shinydashboard, through which it accesses jQuery, bootstrap and AdminLTE, which in turn depend on a plethora of open source web technologies themselves. It also uses dygraphs, and, of course, seasonal, x13binary and X-13ARIMA-SEATS, the wonderful seasonal adjustment software by the U.S. Census Bureau.
Thanks for your feedback, your ideas and bug-reports. Contact me.