
This package provides useful functions for distance matrix objects in R.
You can install usedist from github with:
# install.packages("devtools")
devtools::install_github("kylebittinger/usedist")In R, the dist() function is used to compute a distance
matrix. But the result you get back isn’t really a matrix, it’s a
"dist" object. Under the hood, the "dist"
object is stored as a simple vector. When it’s printed out, R knows how
to make it look like a matrix. Let’s make a distance object representing
the distances between six rows of data.
Here is our data matrix, X:
X <- matrix(rnorm(30), nrow=6)
rownames(X) <- c("A", "B", "C", "D", "E", "F")
X
## [,1] [,2] [,3] [,4] [,5]
## A 1.2629543 -0.928567035 -1.1476570 0.4356833 -0.05710677
## B -0.3262334 -0.294720447 -0.2894616 -1.2375384 0.50360797
## C 1.3297993 -0.005767173 -0.2992151 -0.2242679 1.08576936
## D 1.2724293 2.404653389 -0.4115108 0.3773956 -0.69095384
## E 0.4146414 0.763593461 0.2522234 0.1333364 -1.28459935
## F -1.5399500 -0.799009249 -0.8919211 0.8041895 0.04672617And here is our "dist" object, d,
representing the distance between rows of X:
d <- dist(X)
d
## A B C D E
## B 2.603430
## C 1.821423 2.047355
## D 3.472394 3.727228 3.056922
## E 2.672239 2.653173 2.734967 2.069155
## F 2.843420 2.543180 3.369470 4.373791 3.129488These "dist" objects are great, but R does not provide a
set of functions to work with them conveniently. That’s where the
usedist package comes in.
The usedist package provides some basic functions for
altering or selecting distances from a "dist" object.
library(usedist)To start, we can make a new "dist" object, containing
the distances between rows B, C, F, and D. Our new object contains the
rows in the order we specified:
dist_subset(d, c("B", "C", "F", "D"))## B C F
## C 2.047355
## F 2.543180 3.369470
## D 3.727228 3.056922 4.373791This is especially helpful when arranging a distance matrix to match
a data frame, for instance with the adonis() function in
vegan.
We can extract distances between specified pairs of rows. For
example, we’ll pull out the distances for rows A-to-D, B-to-E, and
C-to-F. To extract specific distance values, we use
dist_get(). This function takes two vectors of row labels:
one vector for the rows of origin, and another for the rows of
destination.
origin_row <- c("A", "B", "C")
destination_row <- c("D", "E", "F")
dist_get(d, origin_row, destination_row)
## [1] 3.472394 2.653173 3.369470If rows are arranged in groups, we might like to have a data frame
listing the distances alongside the groups for each pair of rows. The
dist_groups() function makes a data frame from the groups,
and also adds in a nice label that you might use for plots.
item_groups <- rep(c("Control", "Treatment"), each=3)
dist_groups(d, item_groups)
## Item1 Item2 Group1 Group2 Label Distance
## 1 A B Control Control Within Control 2.603430
## 2 A C Control Control Within Control 1.821423
## 3 A D Control Treatment Between Control and Treatment 3.472394
## 4 A E Control Treatment Between Control and Treatment 2.672239
## 5 A F Control Treatment Between Control and Treatment 2.843420
## 6 B C Control Control Within Control 2.047355
## 7 B D Control Treatment Between Control and Treatment 3.727228
## 8 B E Control Treatment Between Control and Treatment 2.653173
## 9 B F Control Treatment Between Control and Treatment 2.543180
## 10 C D Control Treatment Between Control and Treatment 3.056922
## 11 C E Control Treatment Between Control and Treatment 2.734967
## 12 C F Control Treatment Between Control and Treatment 3.369470
## 13 D E Treatment Treatment Within Treatment 2.069155
## 14 D F Treatment Treatment Within Treatment 4.373791
## 15 E F Treatment Treatment Within Treatment 3.129488You might have your own distance function that you’d like to use,
beyond the options available in dist() or
vegan::vegdist(). For example, the RMS distance is kind of
like the Euclidean distance, but you take the mean of the squared
differences instead of the sum inside the square root. Let’s define the
distance function:
rms_distance <- function (r1, r2) {
  sqrt(mean((r2- r1) ^ 2))
}
Then, we can pass it to dist_make() to create a new
distance matrix of RMS distances.
dist_make(X, rms_distance)## A B C D E
## B 1.1642895
## C 0.8145653 0.9156050
## D 1.5529017 1.6668670 1.3670972
## E 1.1950614 1.1865353 1.2231143 0.9253541
## F 1.2716160 1.1373449 1.5068729 1.9560190 1.3995495The usedist package contains functions for computing the
distance to group centroid positions. This is accomplished without
finding the location of the centroids themselves, though it is assumed
that some high-dimensional Euclidean space exists where the centroids
can be situated. References for the formulas used can be found in the
function documentation.
To illustrate, let’s create a set of points in 2-dimensional space. Four points will be centered around the origin, and four around the point (3, 0).
pts <- data.frame(
  x = c(-1, 0, 0, 1, 2, 3, 3, 4),
  y = c(0, 1, -1, 0, 0, 1, -1, 0),
  Item = LETTERS[1:8],
  Group = rep(c("Control", "Treatment"), each=4))

library(ggplot2)
ggplot(pts, aes(x=x, y=y)) +
  geom_point(aes(color=Group)) +
  geom_text(aes(label=Item), hjust=1.5) +
  coord_equal()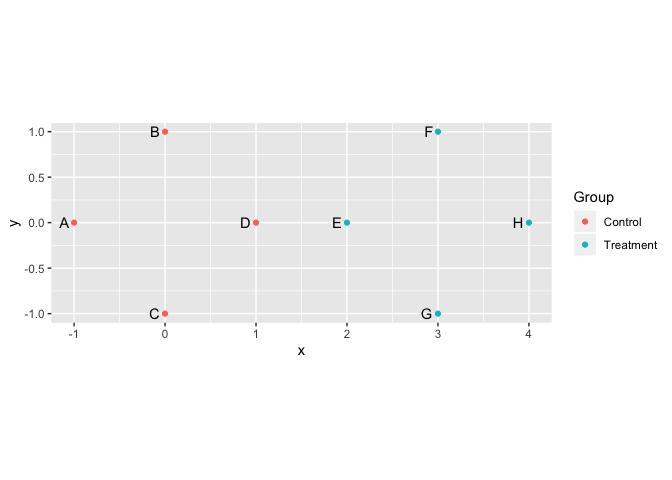
Our goal is to figure out distances for the group centroids using only the distances between points. First, we need to put the data in matrix format.
pts_matrix <- as.matrix(pts[,c("x", "y")])
rownames(pts_matrix) <- pts$Item
Now, we’ll compute the point-to-point distances with
dist().
pts_distances <- dist(pts_matrix)
pts_distances
## A B C D E F G
## B 1.414214
## C 1.414214 2.000000
## D 2.000000 1.414214 1.414214
## E 3.000000 2.236068 2.236068 1.000000
## F 4.123106 3.000000 3.605551 2.236068 1.414214
## G 4.123106 3.605551 3.000000 2.236068 1.414214 2.000000
## H 5.000000 4.123106 4.123106 3.000000 2.000000 1.414214 1.414214The function dist_between_centroids() will calculate the
distance between the centroids of the two groups. Here, we expect to get
a distance of 3.
dist_between_centroids(
  pts_distances, c("A", "B", "C", "D"), c("E", "F", "G", "H"))
## [1] 3The function is only using the distance matrix; it doesn’t know where the individual points are in space.
We can use another function, dist_to_centroids(), to
calculate the distance from each individual point to the group
centroids. Again, this works without knowing the point locations, only
the distances between points. In our example, the distances within the
Control group and within the Treatment group should all be equal to
1.
dist_to_centroids(pts_distances, pts$Group)## Item CentroidGroup CentroidDistance
## 1 A Control 1.000000
## 2 B Control 1.000000
## 3 C Control 1.000000
## 4 D Control 1.000000
## 5 E Control 2.000000
## 6 F Control 3.162278
## 7 G Control 3.162278
## 8 H Control 4.000000
## 9 A Treatment 4.000000
## 10 B Treatment 3.162278
## 11 C Treatment 3.162278
## 12 D Treatment 2.000000
## 13 E Treatment 1.000000
## 14 F Treatment 1.000000
## 15 G Treatment 1.000000
## 16 H Treatment 1.000000You can use the Pythagorean theorem to check that the other distances are correct. The distance between point “G” and the centroid for the Control group should be sqrt(32 + 12) = sqrt(10) = 3.162278.
Many times, the data is not stored as a matrix, but is represented in
“long” format as a data frame. In this case, one column of the data
frame gives the row label for the matrix, another indicates the column
label, and a third provides the value. To get a real data matrix, we
have to “pivot” the data frame and convert to matrix form. Because this
is such a common operation, usedist includes a convenience
function, pivot_to_numeric_matrix.
Here is an example of data in long format:
data_long <- data.frame(
  row_label = c("A", "A", "A", "B", "B", "C", "C"),
  column_label = c("x", "y", "z", "x", "y", "y", "z"),
  matrix_value = rpois(7, 12))
data_long
## row_label column_label matrix_value
## 1 A x 11
## 2 A y 10
## 3 A z 10
## 4 B x 9
## 5 B y 7
## 6 C y 15
## 7 C z 10The data table has no value for row “B” and column “z”. By convention, a value of 0 is filled in for missing combinations when we convert to matrix format. Here is how we convert:
data_matrix <- pivot_to_numeric_matrix(
  data_long, row_label, column_label, matrix_value)
data_matrix
## x y z
## A 11 10 10
## B 9 7 0
## C 0 15 10Note that we provide bare column names in the call to
pivot_to_numeric_matrix(). This function requires some
extra packages to be installed. They are listed as suggestions for
usedist. If the additional packages are not installed on
your system, you’ll get an error message with the missing packages
listed.
The matrix format is what we need for distance calculations. If you
want to convert from long format and use a custom distance function, you
can combine pivot_to_numeric_matrix() with
dist_make():
dist_make(data_matrix, rms_distance)## A B
## B 6.137318
## C 6.976150 9.036961